
Key Highlights
- Ethereum rallied over 15% and cleared the $1,750 resistance.
- ETH surpassed a key bearish trend line with resistance at $1,640 on the daily chart.
- Bitcoin price also rallied and surpassed the $93,500 resistance.
- XRP is showing positive signs, and the bulls could aim for a move toward $2.50.
Ethereum Technical Analysis
Ethereum remained stable above $1,500 and started a fresh increase. ETH cleared a few key hurdles near $1,620 to start a fresh surge.
Looking at the daily chart, the price surpassed a key bearish trend line with resistance at $1,640. The price even surpassed the 50% Fib retracement level of the downward wave from the $2,100 swing high to the $1,380 low.
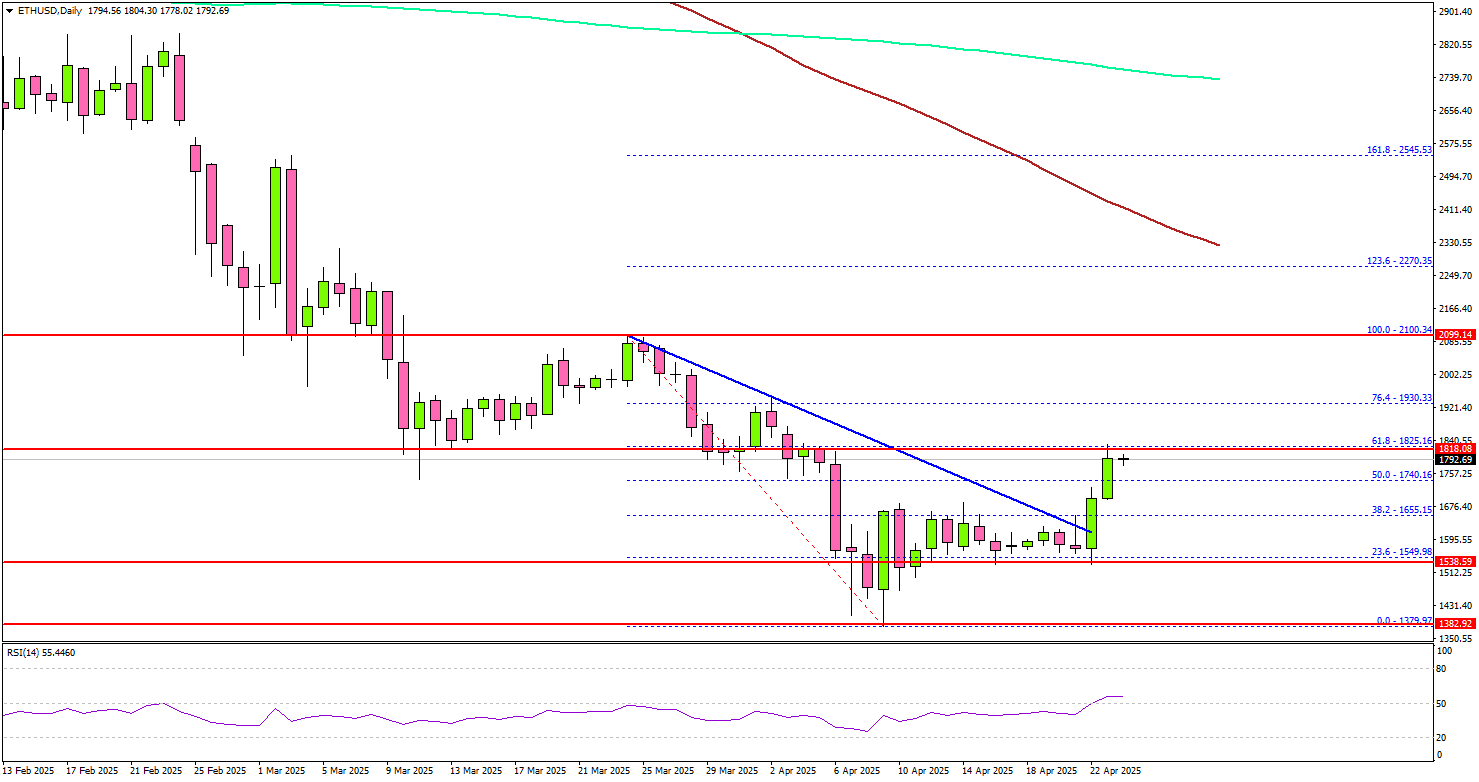
ETH settled above the 100-day simple moving average (red) and the 200-day simple moving average (green). Immediate resistance is near the $1,825 level.
The next major resistance is near the $1,930 level and the 76.4% Fib retracement level of the downward wave from the $2,100 swing high to the $1,380 low. A daily close above the $1,930 resistance zone could start another steady increase. In the stated case, the price may perhaps rise toward the $2,000 level. The next stop for the bulls may perhaps be $2,120.
On the downside, Ethereum might find support near the $1,700 level. The next major support is $1,650, below which the price could slide toward $1,600. Any more losses might call for a move toward the $1,550 level.
Looking at Bitcoin, there was a steady increase above the $92,000 level, and the price might continue to rise toward the $98,000 level.
Economic Releases
- US Initial Jobless Claims – Forecast 221K, versus 215K previous.
- US Durable Goods Orders for March 2025 – Forecast +2% versus +1% previous.