Hello fellow traders. In this technical article, we are going to present Elliott Wave charts of Bitcoin BTCUSD . The crypto is showing impulsive bullish sequences in the cycle from the 74436 low calling for further strength. In the following sections, we will delve into the specifics of the Elliott Wave pattern.
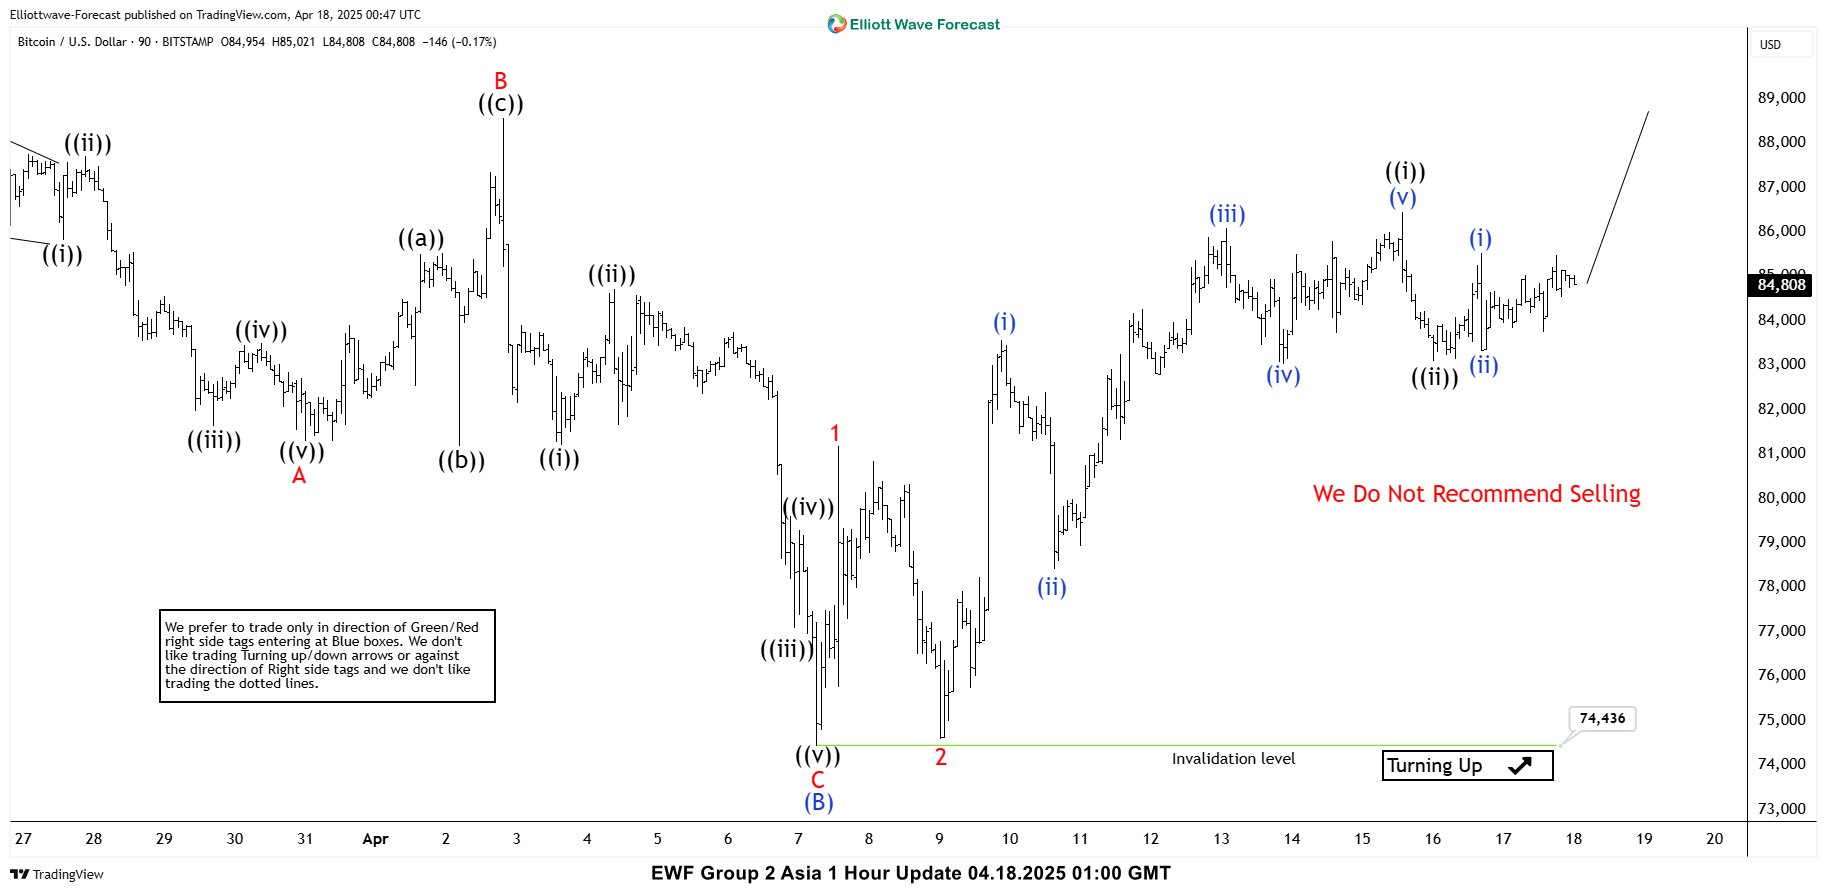
BTCUSD Elliott Wave 1 Hour Chart 04.18.2025
The current analysis suggests that BTCUSD is trading within the cycle from the 74436 low. Intraday pull back ((ii)) black is counted completed at the 83035 low. While above that level we expect further strength in the ctypto.
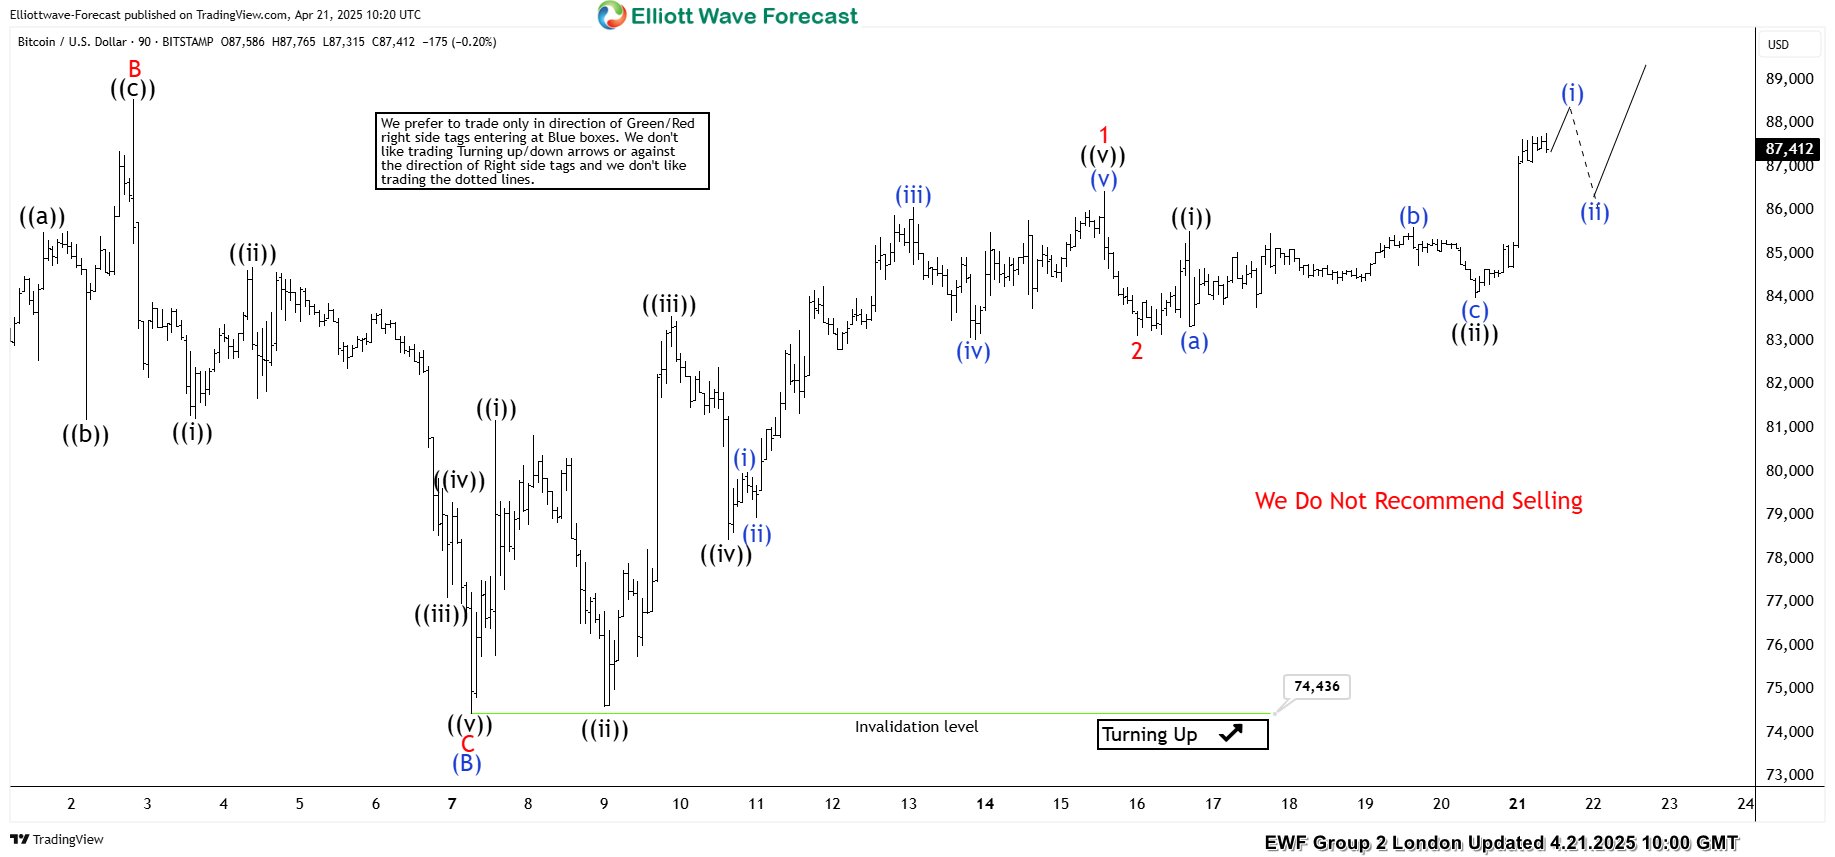
BTCUSD Elliott Wave 1 Hour Chart 04.21.2025
The crypto held above the 74436 low and continued to rally, as expected. The price made break above previous peak and now showing higher high bullish sequences in the cycle from the 74436 , calling for more upside in upcoming days. We do not recommend selling the crypto at this time and favor the long side, targeting 94532-97273 area next.