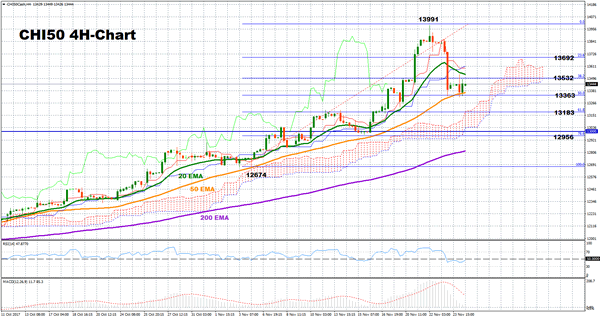
CHI50 started a strong rally in the mid-May, flying to a two-year high – a breath below the 14,000 – key level on November 22. But since then, the index took a knock, sinking by almost 4.0% and falling below the 20-period exponential moving average (EMA) in the four-hour chart, painting a neutral picture in the short-term.
The index is currently consolidating around the 50% Fibonacci of the uptrend from 12674 to 13991 (November 6 -November 22), with technical indicators suggesting the index to record a steady path in the short-term. The RSI has crossed marginally below 50, pointing to the upside while the MACD has flattened near zero.
A move to the downside would meet both the 50% Fibonacci and the 50-period EMA at 13363. However, a break below this level would strengthen downside pressure, leading the index down to the 13000 key-level and the 78.6% Fibonacci of 12956. Steeper declines could also target the bottom of the Fibonacci upleg at 12674.
Otherwise, upside movements could find an immediate resistance around 13532 where the 20-period EMA and the 38.2% Fibonacci lay. From here, the 23.6% Fibonacci of 13692 and the previous top at 13991 could be potential resistance levels as well.
In the medium-term, the outlook is positive given that the bullish cross between the 20 and the 50-period EMA is still intact. The index itself gives a clear positive signal as well as it has been making higher highs and lower lows since June.

