
Key Highlights
- Ethereum found support near $1,375 and corrected some losses.
- ETH is still well below a key bearish trend line with resistance at $1,740 on the daily chart.
- Bitcoin price must settle above $88,000 to start a fresh increase.
- XRP could gain bullish momentum if it clears the $2.250 resistance.
Ethereum Technical Analysis
Ethereum declined heavily below the $2,000 zone, like Bitcoin. ETH traded below the $1,800 and $1,550 support levels before the bulls appeared near $1,375.
Looking at the daily chart, the price settled well below the 100-day simple moving average (red) and the 200-day simple moving average (green). A low was formed at $1,379 and the price recently started a recovery wave.
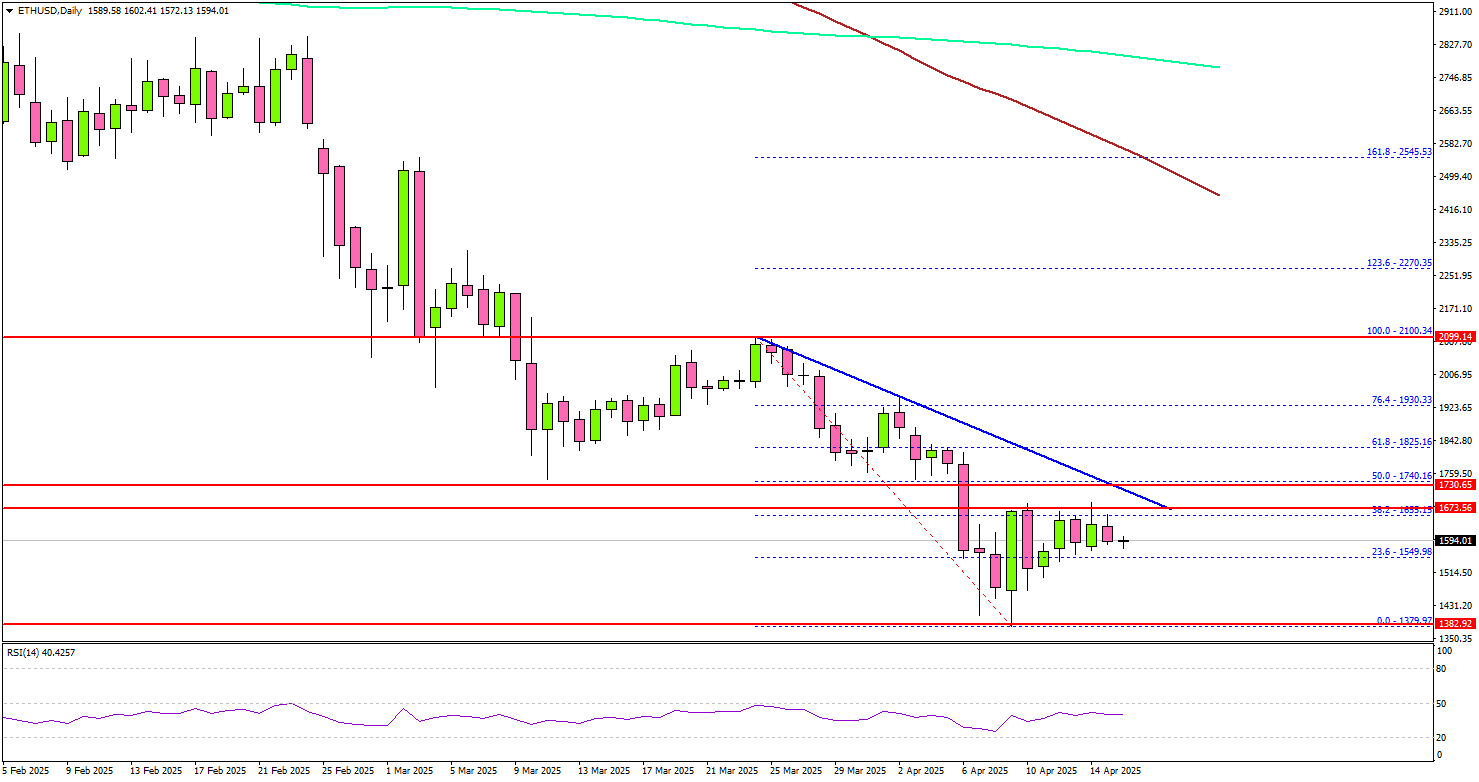
There was a move above the 23.6% Fib retracement level of the downward move from the $2,100 swing high to the $1,379 low. Immediate resistance is near the $1,675 level.
The next major resistance is near the $1,740 level. There is also a key bearish trend line forming with resistance at $1,740 on the same chart. The trend line is close to the 50% Fib retracement level of the downward move from the $2,100 swing high to the $1,379 low.
A daily close above the $1,740 resistance zone could start another steady increase. In the stated case, the price may perhaps rise toward the $2,000 level. The next stop for the bulls may perhaps be to $2,100.
On the downside, Ethereum might find support near the $1,450 level. The next major support is $1,375, below which the price could slide toward $1,320. Any more losses might call for a move toward the $1,200 level.
Looking at Bitcoin, there was a steady increase above the $84,000 level, and the price might continue to rise toward the $88,000 level.
Economic Releases
- Fed’s Chair Powell speech.
- US Retail Sales for March 2025 (MoM) – Forecast +1.3%, versus +0.2% previous.