
Key Highlights
- Bitcoin price started a recovery wave after a sharp drop to $75,000.
- BTC is trading below a connecting bearish trend line with resistance at $81,500 on the 4-hour chart.
- Ethereum price declined heavily and even tested the $1,420 zone.
- WTI crude oil prices started a consolidation phase near $60.00.
Bitcoin Price Technical Analysis
Bitcoin price started a major decline below $85,000 against the US Dollar. BTC declined below $80,000 and tested $75,000 before the bulls appeared.
Looking at the 4-hour chart, the price settled below the $82,000 level, the 100 simple moving average (red, 4-hour) and the 200 simple moving average (green, 4-hour). A low was formed at $74,376 and the price started an upside correction.
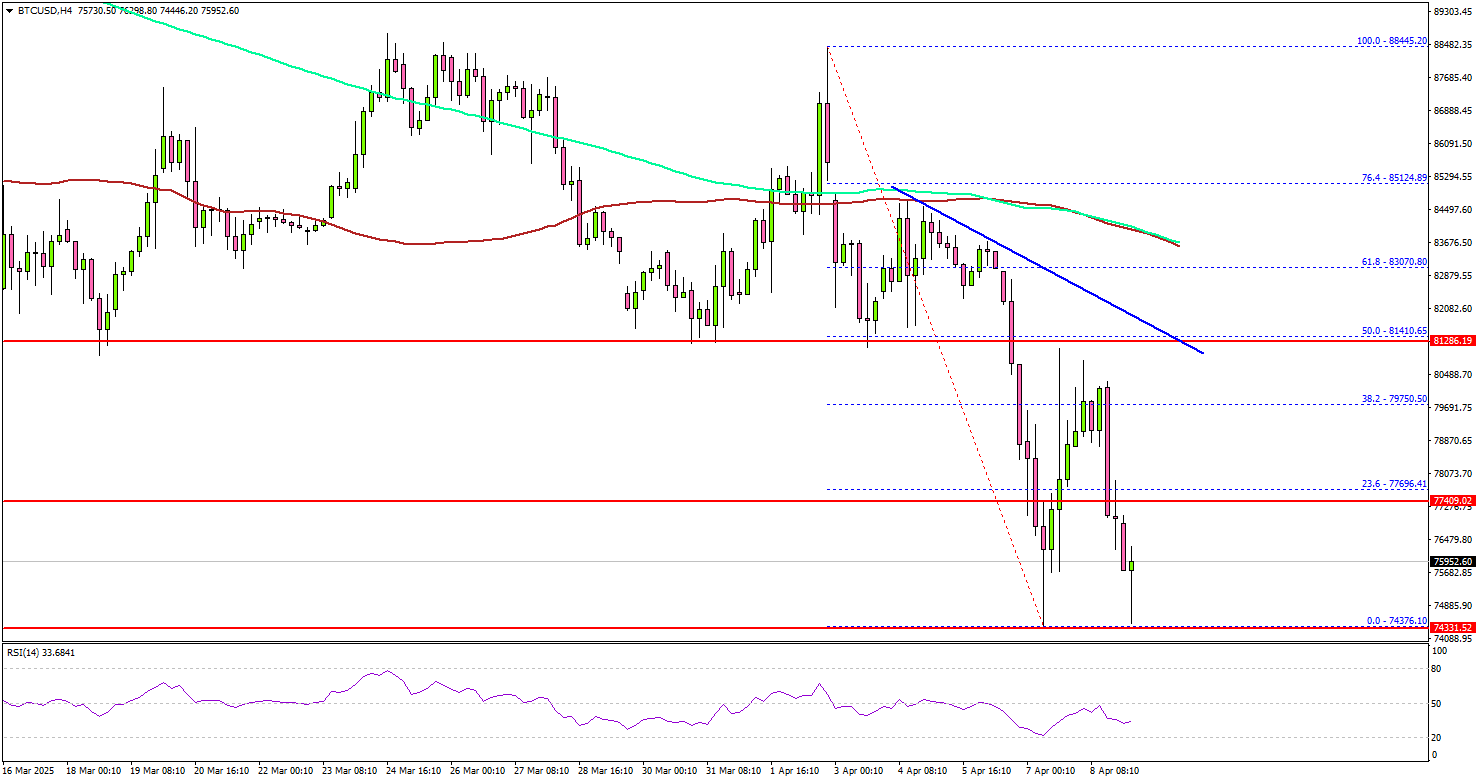
There was a move above the $78,000 level. The price climbed above the 38.2% Fib retracement level of the downward move from the $88,445 swing high to the $74,376 low.
On the upside, the price could face resistance near the $81,500 level. There is also a connecting bearish trend line forming with resistance at $81,500 on the same chart. The trend line is close to the 50% Fib retracement level of the downward move from the $88,445 swing high to the $74,376 low.
The next key resistance is $83,000. The main resistance could be $85,000. A successful close above $85,000 might start another steady increase. In the stated case, the price may perhaps rise toward the $88,000 level. Any more gains might call for a test of $90,000.
Immediate support is near the $78,000 level. The next key support sits at $76,800. A downside break below $76,800 might send Bitcoin toward the $75,000 support. Any more losses might send the price toward the $73,200 support zone.
Looking at Ethereum, there was a major decline below $2,000 and $1,800 before the bulls appeared near the $1,420 level.
Today’s Economic Releases
- FOMC Minutes.