published in members area of the website. As our members know, NQ_F has shown incomplete bearish sequences in the cycle from the 22410.9 peak (December 2024 ). The price structure indicated further weakness. In the following text, we will provide a more detailed explanation of the Elliott Wave forecast.)
Hello fellow traders. In this technical article we’re going to look at the Elliott Wave charts of NASDAQ ( NQ_F ) published in members area of the website. As our members know, NQ_F has shown incomplete bearish sequences in the cycle from the 22410.9 peak (December 2024 ). The price structure indicated further weakness. In the following text, we will provide a more detailed explanation of the Elliott Wave forecast.
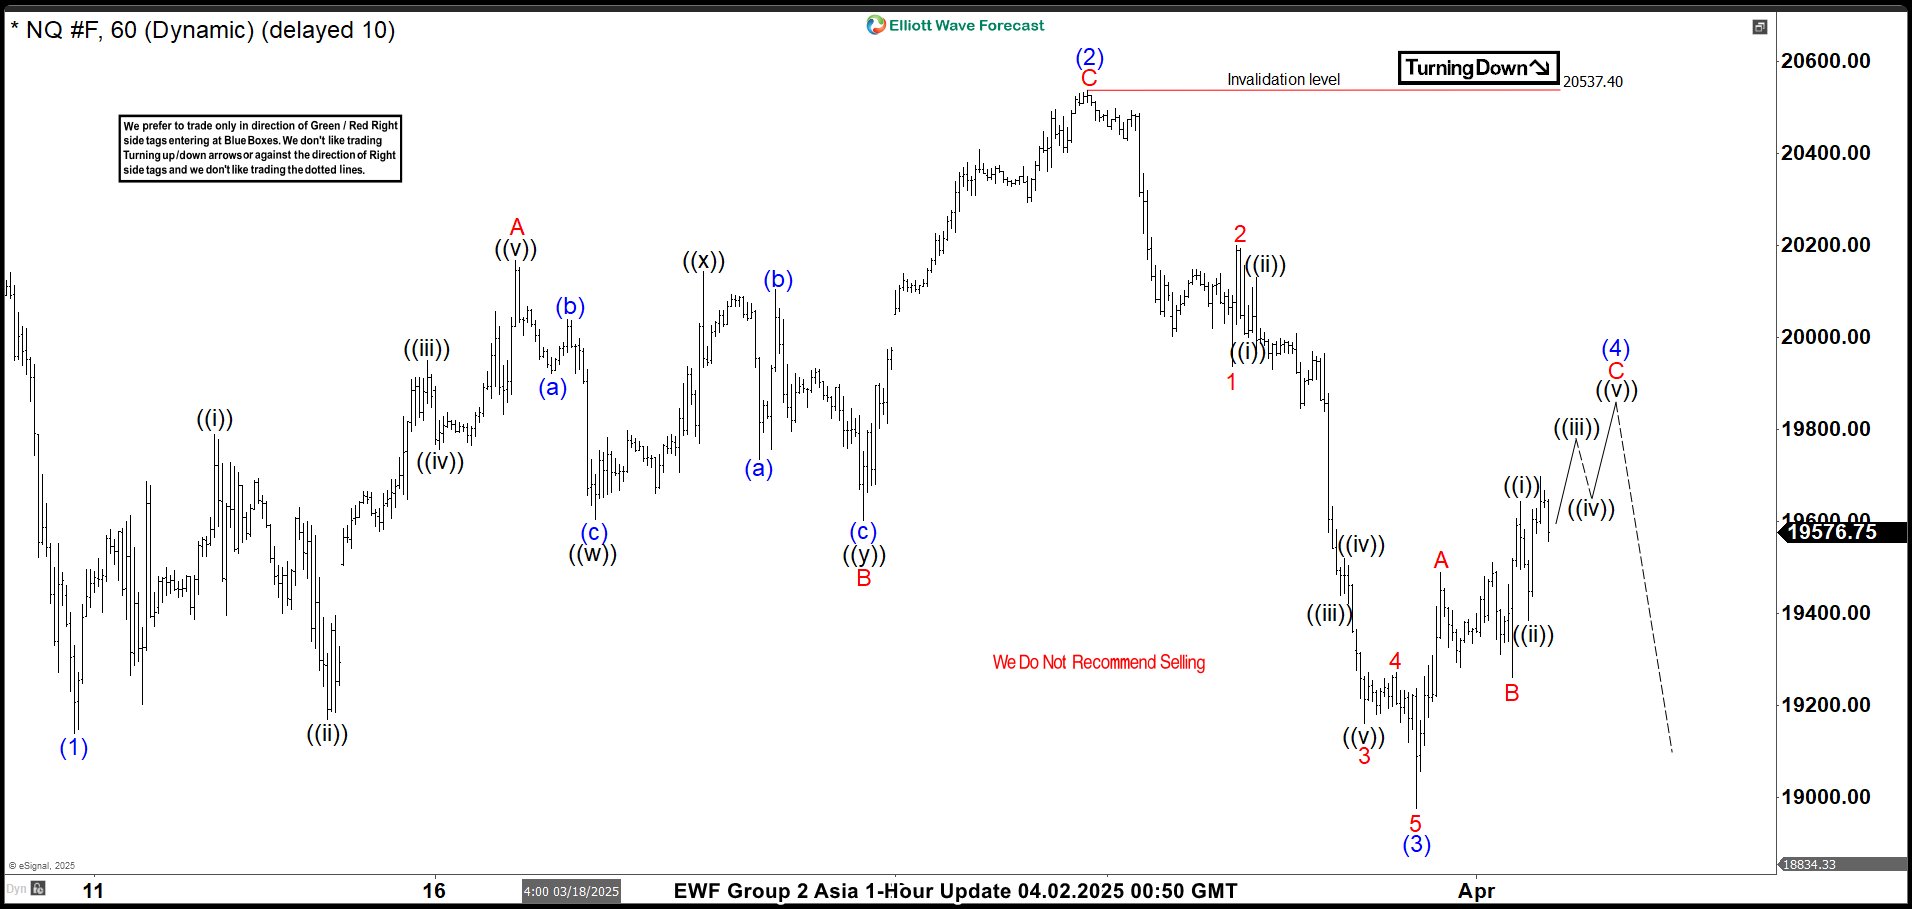
NQ_F Elliott Wave 1 Hour Asia Chart 04.02.2025
The break of the March 10th low, marked on the chart as (1) in blue, created incomplete bearish sequences in NQ_F. We anticipated a further drop as long as the pivot at the 20,537.4 peak holds. Currently, NASDAQ is undergoing a 3-wave recovery in (4) blue, which is expected to complete around the 19,761–20,215 area. We do not recommend forcing trades at this stage and expect NQ_F to continue dropping towards new lows.
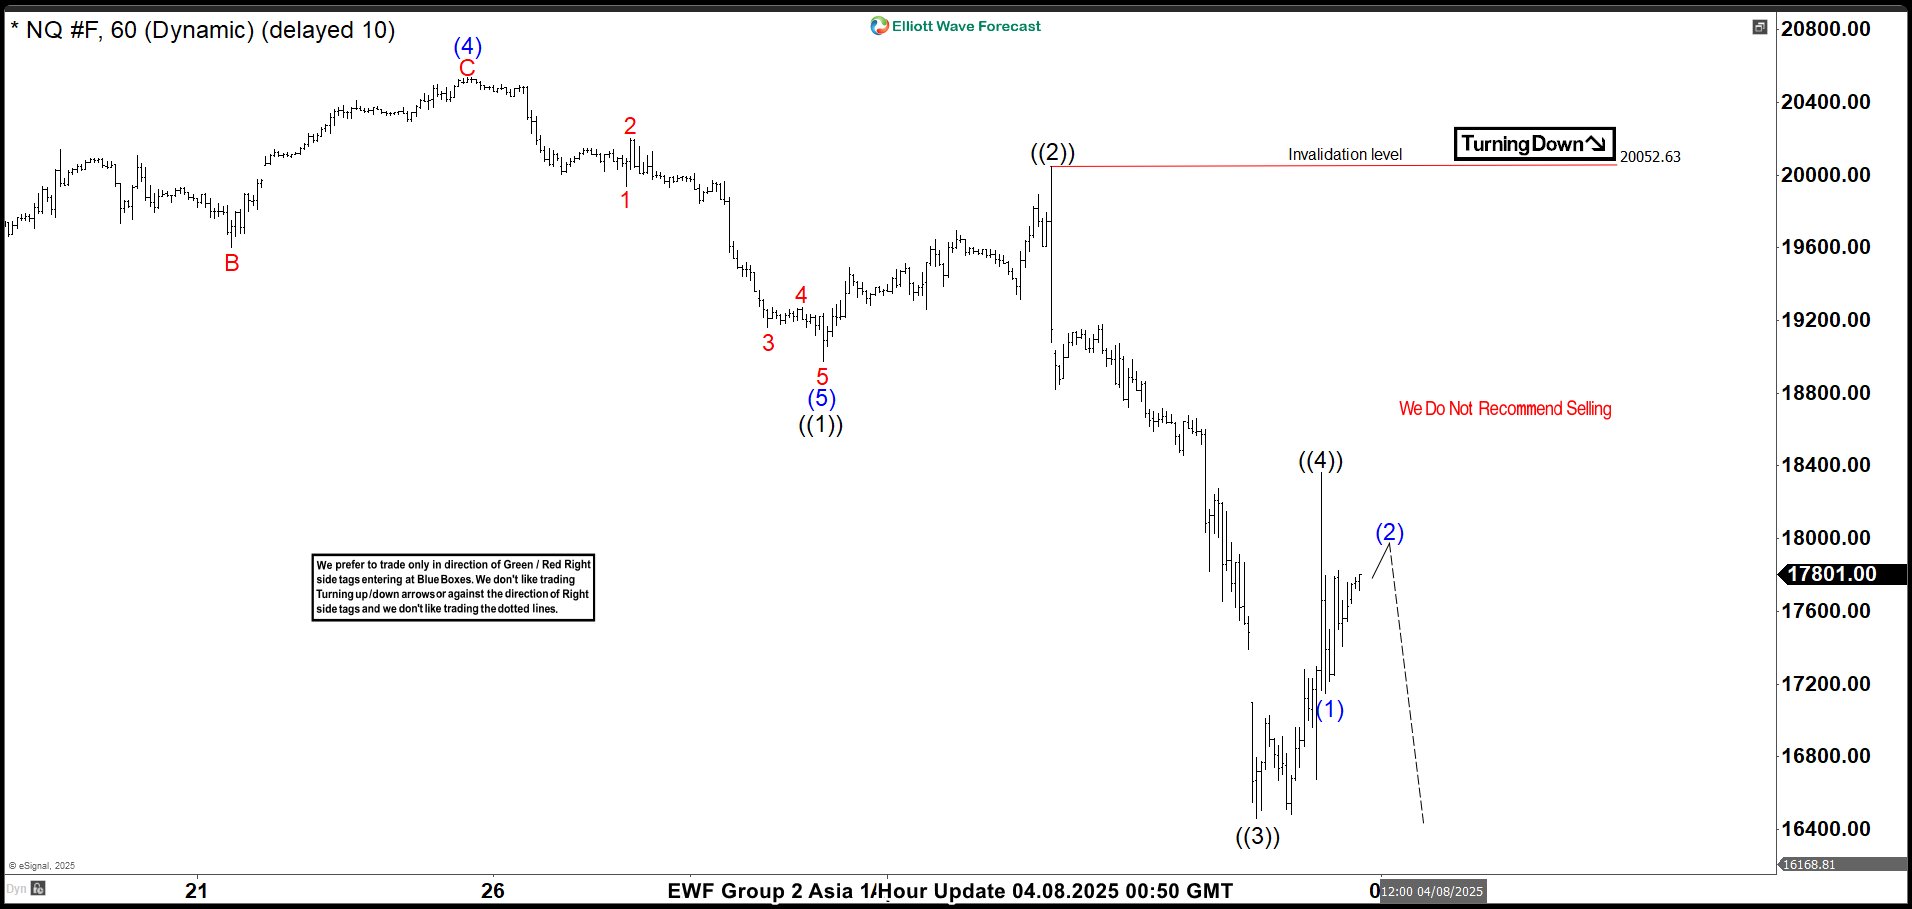
NQ_F Elliott Wave 1 Hour Asia Chart 04.08.2025
NASDAQ completed its recovery at the 20,052.63 peak and then declined further toward new lows, as expected. The current view suggests that as long as the price stays below 18,358, another low could be seen. NQ_F may drop toward the 17,202–16,417 range to complete the proposed cycle from the December 2024 peak.