
 has failed to have a positive follow-through in April after March’s stellar monthly gain of 9.3% despite a global risk-off environment seen in the past two weeks.)
- Gold (XAU/USD) has failed to have a positive follow-through in April after March’s stellar monthly gain of 9.3% despite a global risk-off environment seen in the past two weeks.
- The stagflation environment arising from the latest US reciprocal trade tariffs may have already been priced into Gold (XAU/USD).
- Technical factors are taking the driver’s seat in the short to medium-term over fundamentals as earlier bullish positioning may see adjustments and unwinding.
- Watch the US$2,936 potential downside trigger level on Gold (XAU/USD).
This is a follow-up analysis of our prior report “Gold: Stagflation fears are supporting fresh new all-time highs” published on 5 February 2025.
Since our last publication, the price actions of Gold (XAU/USD) have staged the expected up move and rallied by 11%. The bullish impulsive up move sequence surpassed the US$3,084 medium-term resistance highlighted in our prior analysis on 28 March and printed a recent fresh all-time intraday high of US$3,168 on 3 April.
However, Gold (XAU/USD) seems to be facing the typical “buy the rumour, sell the news” syndrome. After a recent strong rally in March, where it recorded a monthly gain of 9.3% on the backdrop of stagflation fears, it has failed to have a positive follow-through so far in April.
Hence, the increased probability of the stagflation environment arising from the latest US reciprocal trade tariffs may have already been priced in by the movements of gold during the up move in March.
Fundamentals are still supporting the continuation of Gold’s major uptrend phase
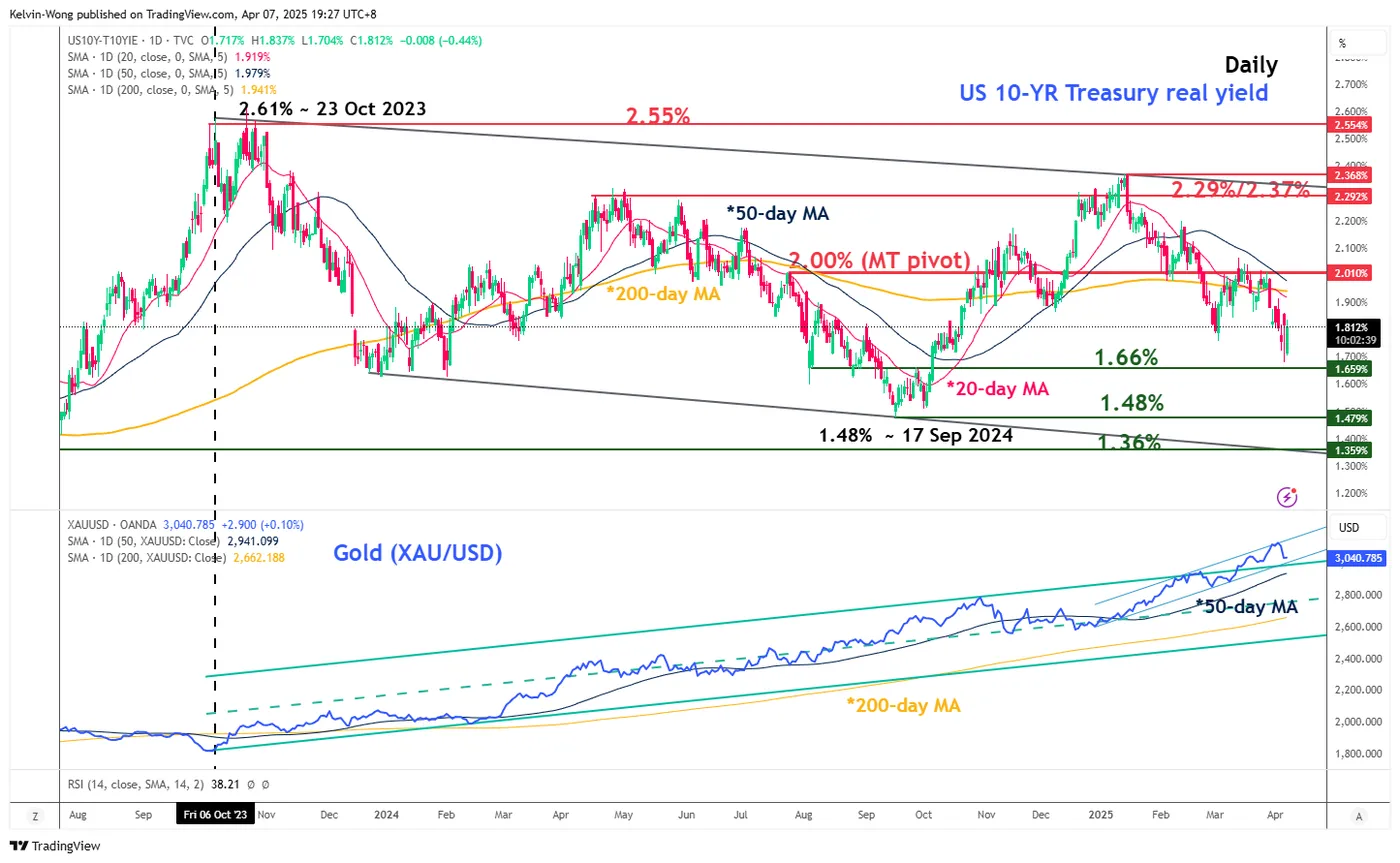
Fig 2: US 10-YR Treasury real yield medium-term & major trends as of 7 Apr 2025 (Source: TradingView)
The ongoing major uptrend phase of Gold (XAU/USD) has been in place since early October 2023 and has an indirect correlation with the longer-term US 10-year Treasury real yield, where its price actions have been evolving within a major descending range channel over the same period (see Fig 1).
Gold (XAU/USD) is considered a zero-yielding asset as it does not generate fixed interest income. Thus, if sovereign bond yields go down such as the yields on US Treasuries, the opportunity costs for holding gold will be lower, in turn, driving up demand for gold, which eventually may see an increase in the price of gold.
The 10-year US Treasury real yield has dropped by 69 basis points (bps) since the 15 January high of 2.37% to print a recent low of 1.68% on last Friday, 4 April. It may face further downside pressure as it continues to trade below its key 200-day moving average, with the risk of retesting the 17 September 2024 medium-term swing low of 1.48% if the 1.66% level is broken down to the downside.
However, this fundamental catalyst is not having a positive impact on the price actions of Gold (XAU/USD), while technical factors are likely to be in the driver’s seat at this juncture. Thus, the prices of Gold (XAU/USD) now may see some form of bullish positioning adjustments and unwinding.
Bearish MACD trend condition
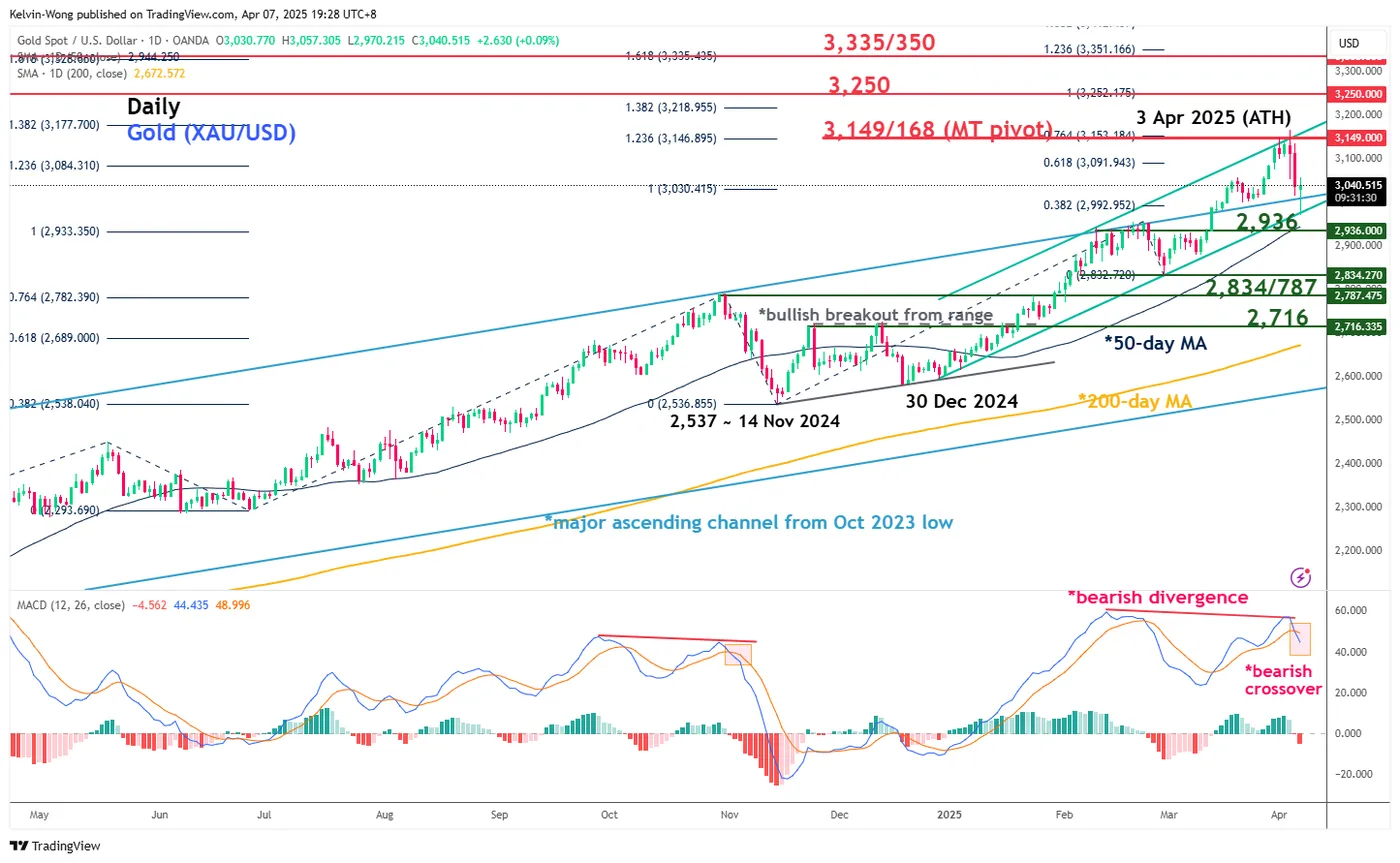
Fig 2: Gold (XAU/USD) medium-term & major trends as of 7 Apr 2025 (Source: TradingView)
The daily MACD trend indicator of Gold (XAU/USD) flashed out a bearish crossover on last Friday, 4 April, and an earlier bearish divergence condition on Thursday, 3 April.
These observations suggest that there may be a change of direction for its medium-term uptrend phase from the 30 December 2024 low towards a potential multi-week corrective decline sequence.
A similar bearish condition on the daily MACD indicator has been flashed in the past on 1 November 2024, where the price actions of Gold (XAU/USD) shaped a multi-week decline of 7.60% before a swing low was formed on 14 November 2024 (see Fig 2).
Watch the US$3,149/3,168 key medium-term pivotal resistance, and a break below the intermediate support of US$2,936 (also the 50-day moving average) may trigger a potential multi-week corrective decline to expose the medium-term support zone of US2,834/2,787.
On the other hand, a clearance above US$3,168 invalidates the bearish scenario for the continuation of the bullish impulsive up move sequence for the next medium-term resistances to come in at US$3,250, and US$3,335/3,350.