published in members area of the website. As our members know, Bitcoin is currently correcting its short-term cycle from the 76,612 low. In the following analysis, we will break down the Elliott Wave forecast and identify the key target area.)
Hello fellow traders. In this technical article we’re going to look at the Elliott Wave charts of Bitcoin (BTCUSD) published in members area of the website. As our members know, Bitcoin is currently correcting its short-term cycle from the 76,612 low. In the following analysis, we will break down the Elliott Wave forecast and identify the key target area.
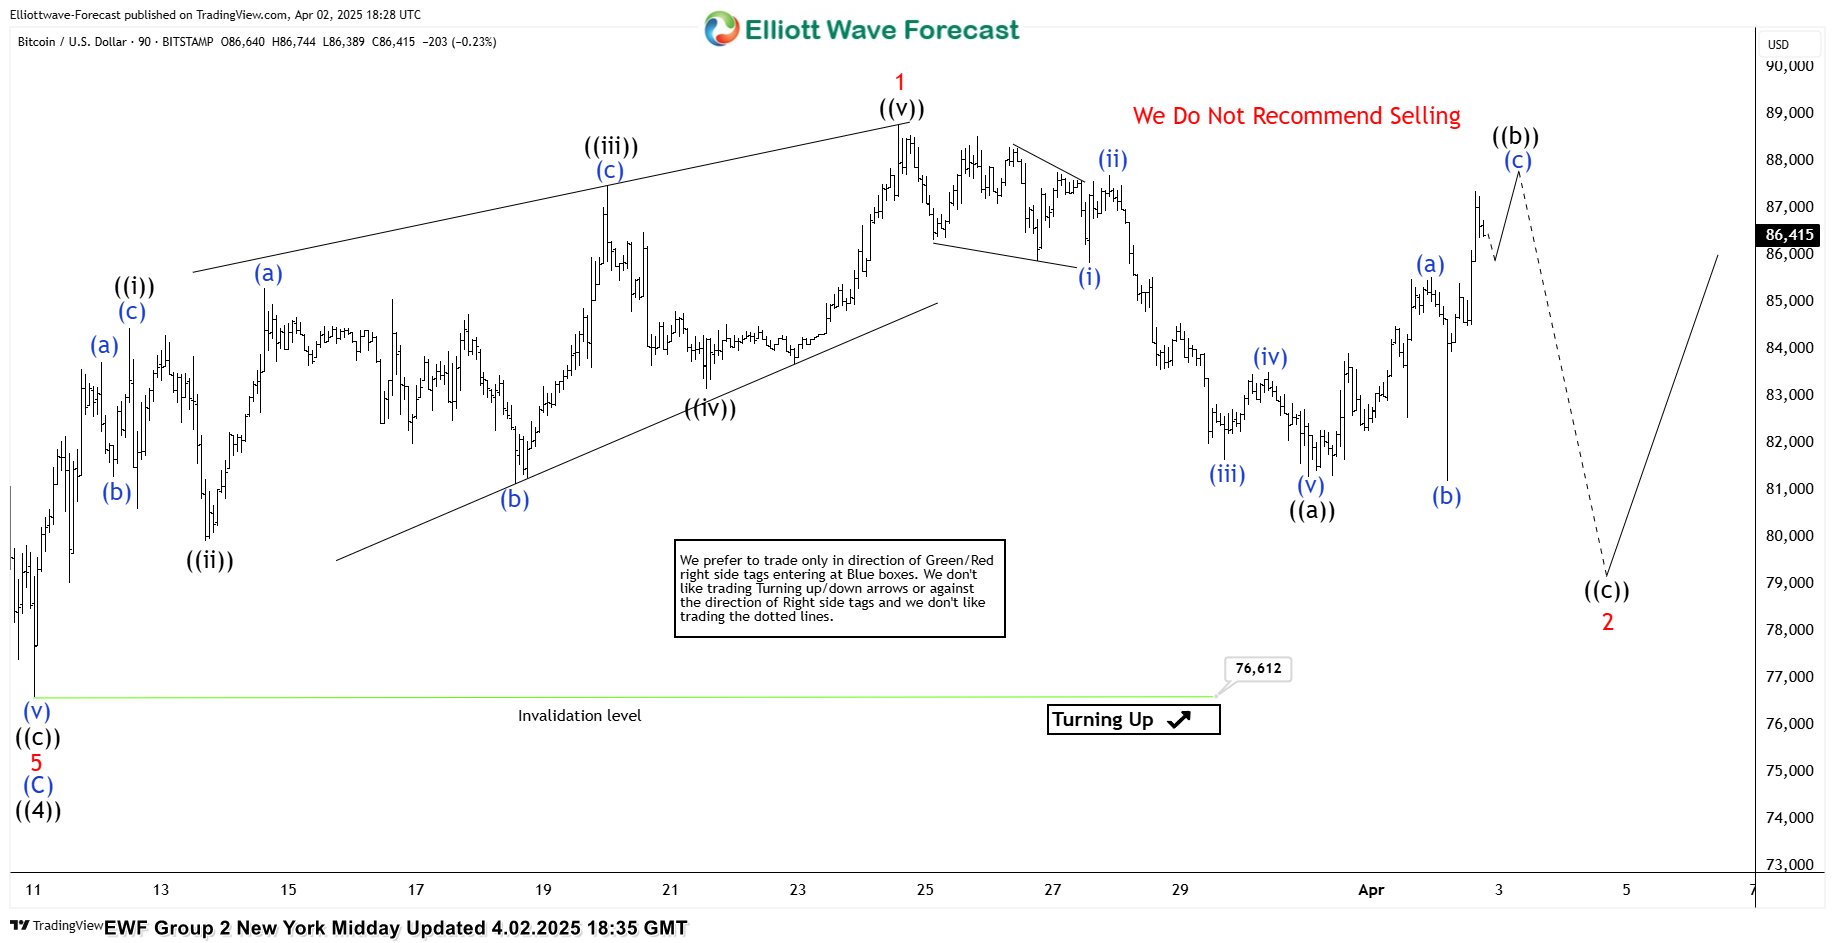
BTCUSD Elliott Wave 1 Hour Chart 04.02.2025
The pullback still looks incomplete at the moment. We count five waves down from the peak, suggesting we have only the first leg ((a)) of wave 2 which is unfolding as a Zig Zag pattern. As long as the price remains below 88760 peak , we anticipate another leg down as proposed on the chart.
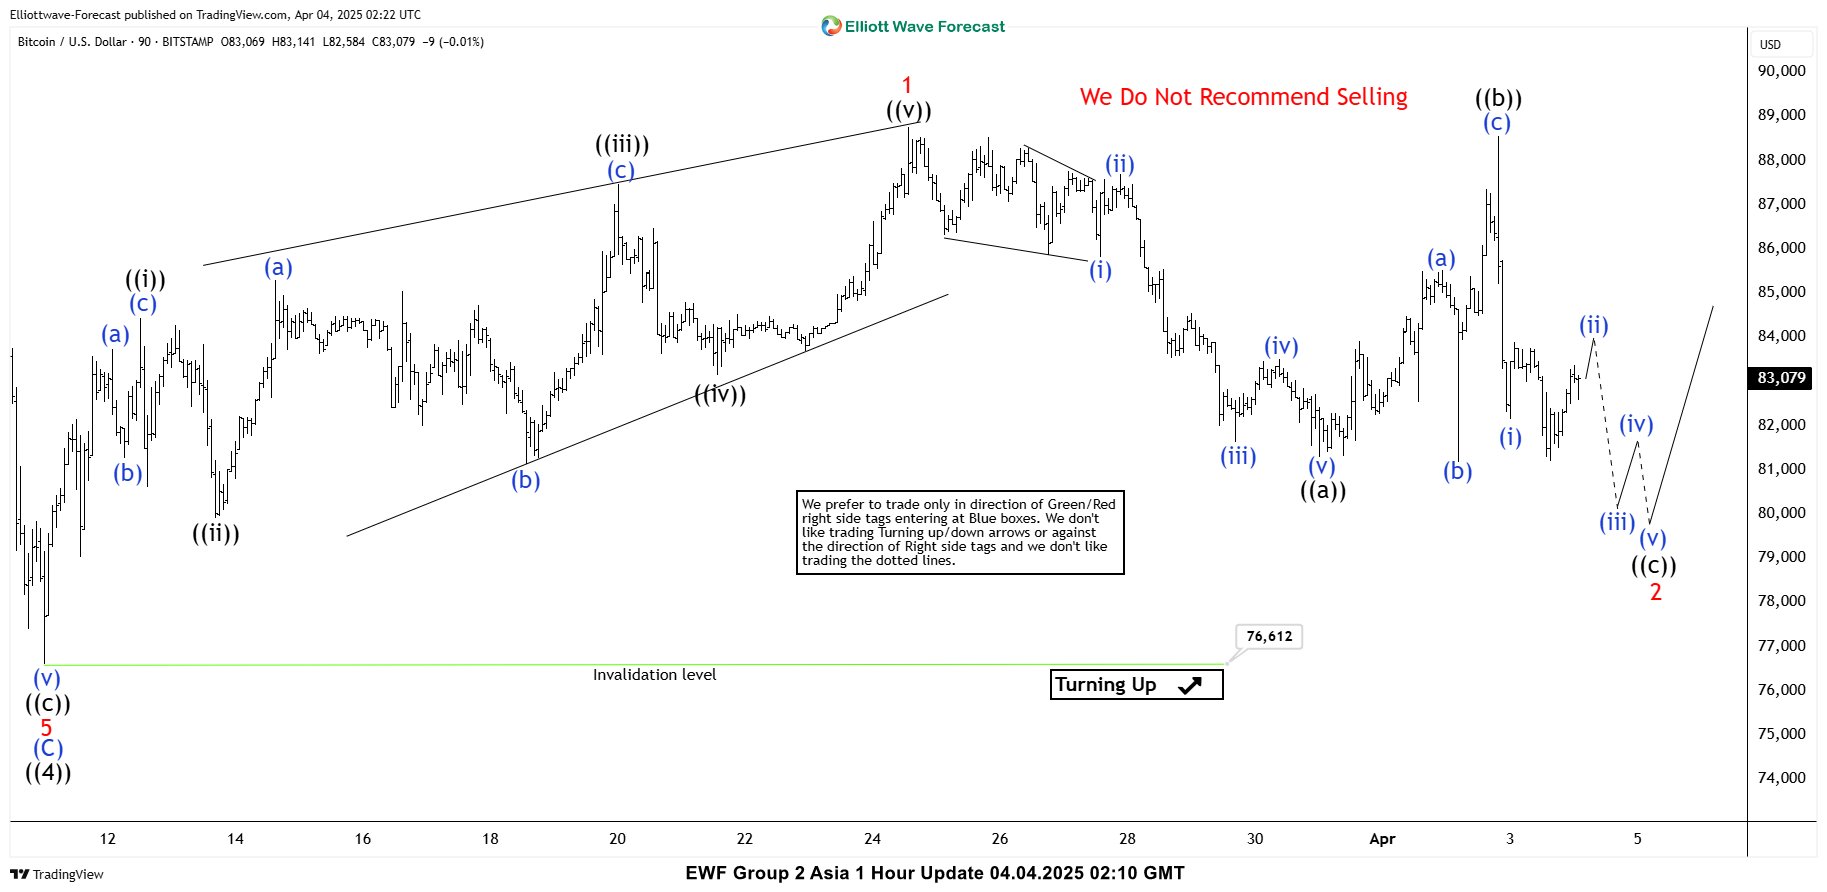
BTCUSD Elliott Wave 1 Hour Chart 04.04.2025
The price has remained below the 88,760 peak, and the expected decline has followed. BTCUSD has yet to reach the extreme zone. There may be further short-term weakness, with potential support between 80,967 and 79,159. At this stage, we do not recommend selling.