Hello fellow traders. In this technical article we’re going to look at the Elliott Wave charts of Dollar Index DXY published in members area of the website. As our members know , Dollar shows bearish sequences in the cycle from the 110.157 peak. In the following text, we will explain the Elliott Wave forecast in more detail.
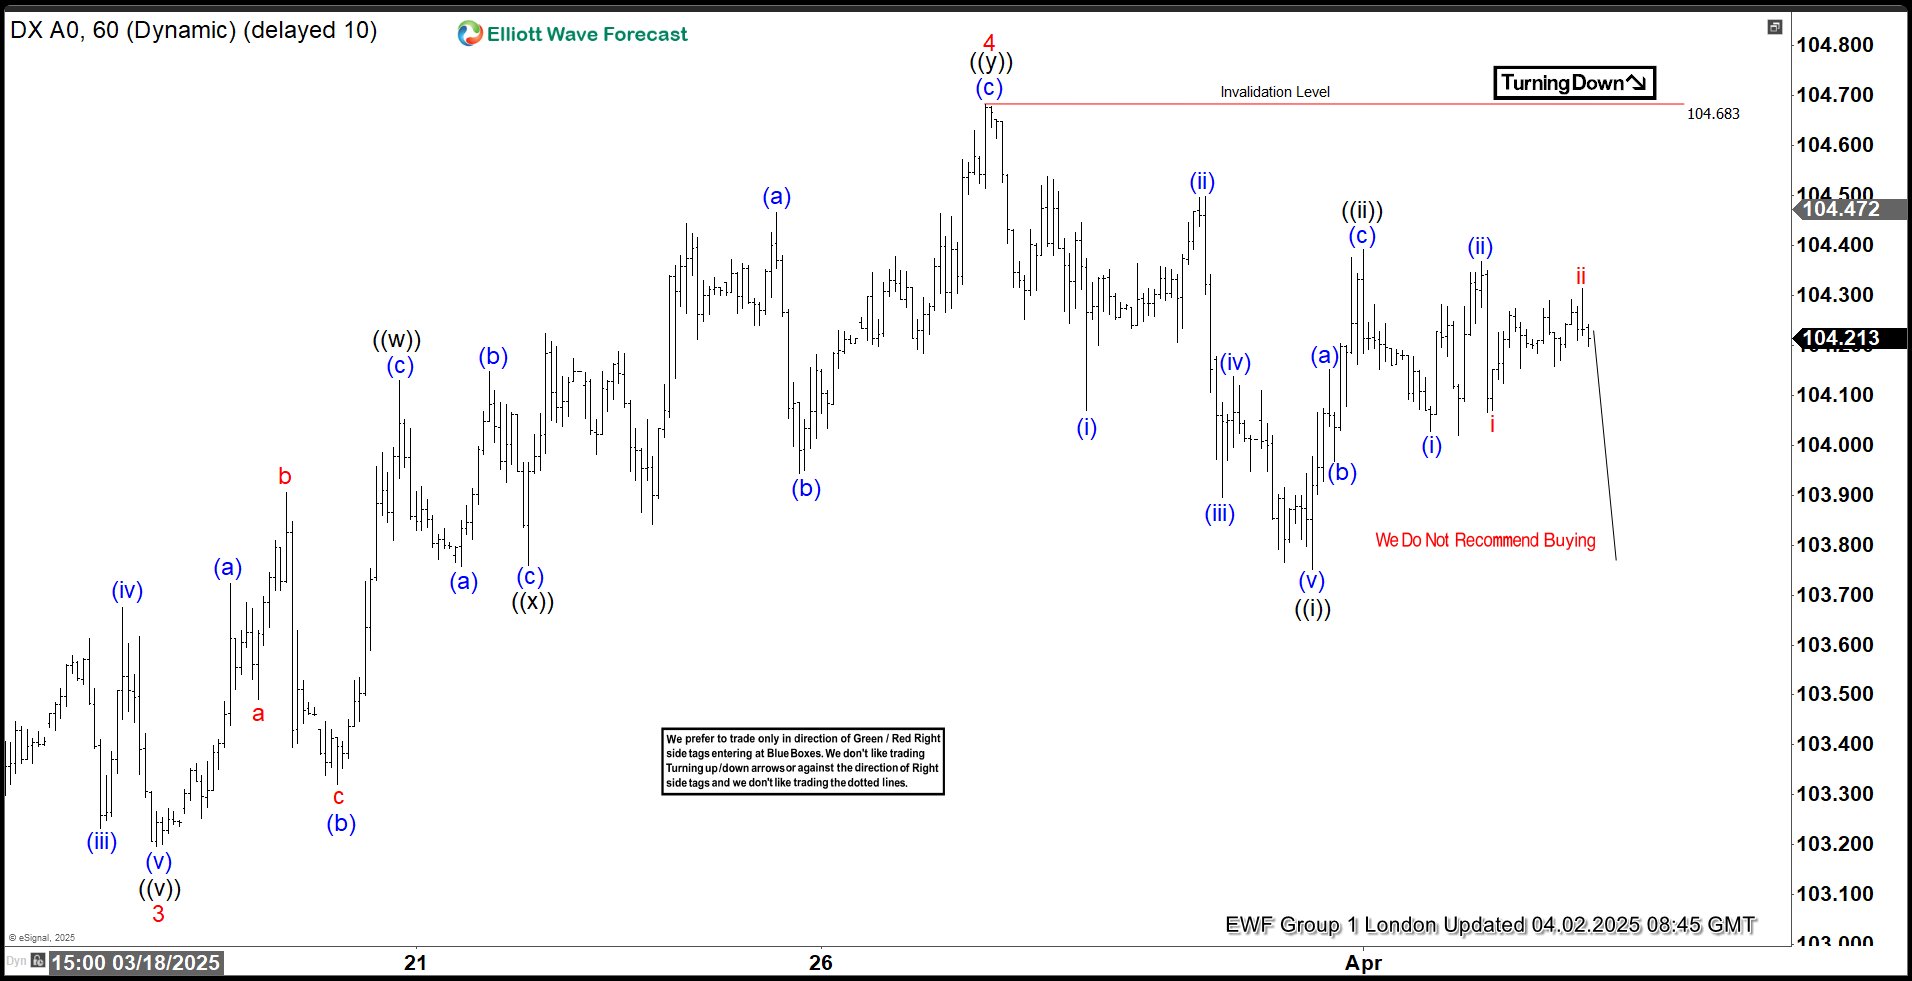
Dollar Index DXY Elliott Wave 1 Hour Chart 04.02.2025
As mentioned earlier, Dollar is showing bearish sequences – 5 waves pattern from the 110.15 high, and we expect further weakness in the US Dollar. Current Elliott Wave analysis suggests that DXY completed a three-wave recovery at the 104.68 high, marked as wave 4 red. As long as the price remains below this level, we anticipate continued downside in Dollar index..
At this stage, we do not recommend buying and favoring the short side.
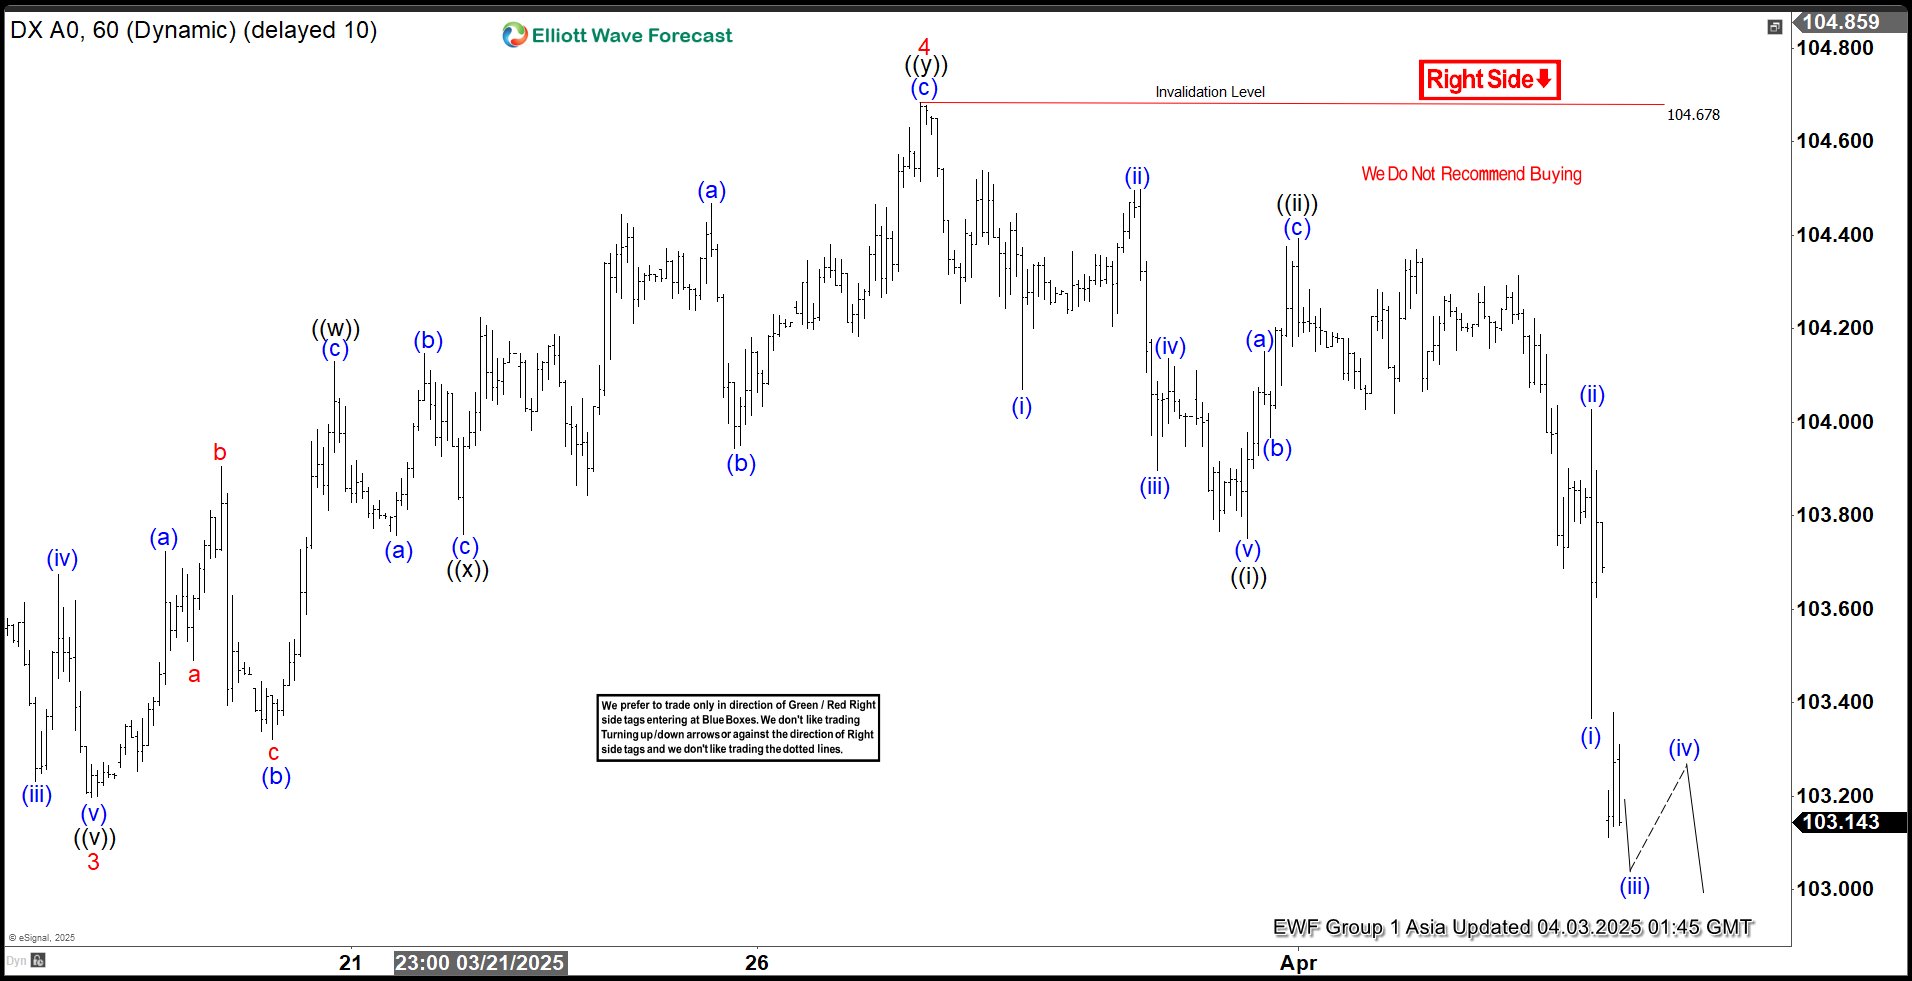
Dollar Index DXY Elliott Wave 1 Hour Chart 04.03.2025
The price remained below the marked invalidation level, leading to a further decline as anticipated. Eventually, it broke the previous low at 103.22, confirming that the next leg down is underway. The Dollar Index remains bearish as long as it holds the 104.67 pivot. We anticipate continued weakness, with a downside target of 101.51 (wave 5 = wave 1).