
Key Highlights
- GBP/USD started a downside correction from the 1.3000 resistance zone.
- It traded below a connecting bullish trend line with support at 1.2960 on the 4-hour chart.
- EUR/USD dipped below the 1.0850 and 1.0800 support levels.
- The US GDP could grow 2.3% in Q4 2024.
GBP/USD Technical Analysis
The British Pound struggled to continue higher above 1.3015 against the US Dollar. GBP/USD started a downside correction below the 1.2950 level.
Looking at the 4-hour chart, the pair traded below a connecting bullish trend line with support at 1.2960. The pair dipped below the 23.6% Fib retracement level of the upward move from the 1.2557 swing low to the 1.3014 high.
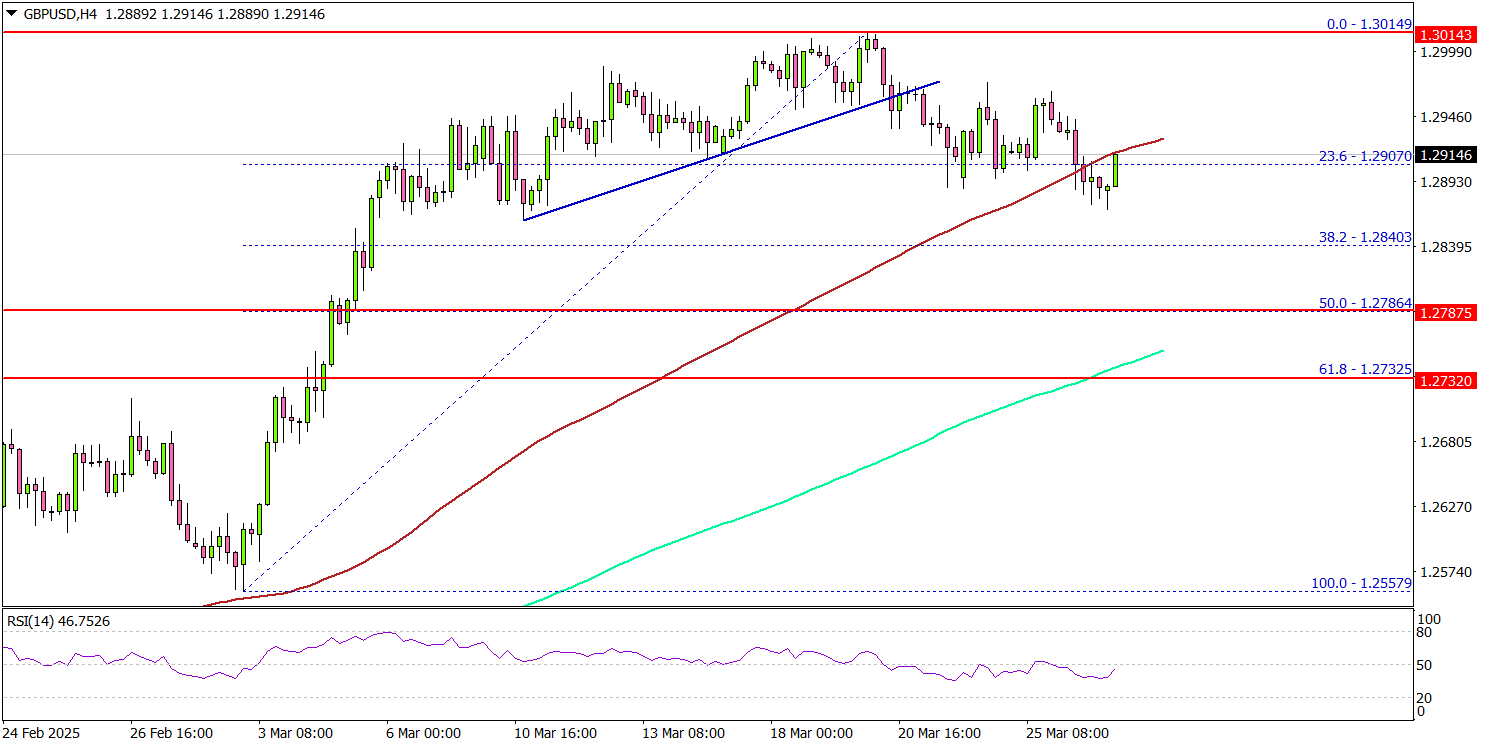
There was a move below the 1.2920 support and the 100 simple moving average (red, 4-hour), but the pair is still above the 200 simple moving average (green, 4-hour).
On the upside, the pair is facing resistance near the 1.2950 level. The next major resistance is near the 1.2980 level. The main resistance is now forming near the 1.3000 zone. A close above the 1.3000 level could set the tone for another increase. In the stated case, the pair could even clear the 1.3080 resistance.
On the downside, immediate support sits near the 1.2840 level. The next key support sits near the 1.2785 level and the 50% Fib retracement level of the upward move from the 1.2557 swing low to the 1.3014 high. Any more losses could send the pair toward the 1.2730 level.
Looking at EUR/USD, the pair started a short-term downside correction after the bulls failed to clear the 1.0950 resistance zone.
Upcoming Economic Events:
- US Gross Domestic Product for Q4 2024 – Forecast 2.3% versus previous 2.3%.
- US Initial Jobless Claims – Forecast 225K, versus 223K previous.