Technical Analysis
- WTI Crude Oil: Attempting to break out of a consolidation range.
- Key Resistance: $70 (psychological level) & 50-day EMA.
- Key Support: $67-$65 range (historical support for three years).
- Brent Crude: Following a similar pattern, testing the 50-day EMA resistance.
Fundamental Drivers
- U.S. Sanctions on Iran could tighten supply.
- OPEC+ production adjustments may balance increased output against voluntary cuts.
- Ceasefire talks in Ukraine could impact Russian crude supply.
- Tariff uncertainty from the U.S. could influence demand expectations.
Key Takeaway for Traders
- Bullish bias above $67: A breakout past $70 and the 50-day EMA could trigger further upside.
- Buying dips: Strong support at $65-$67 makes pullbacks attractive buying opportunities.
- Volatility ahead: Watch for geopolitical shifts & OPEC+ actions as key catalysts.
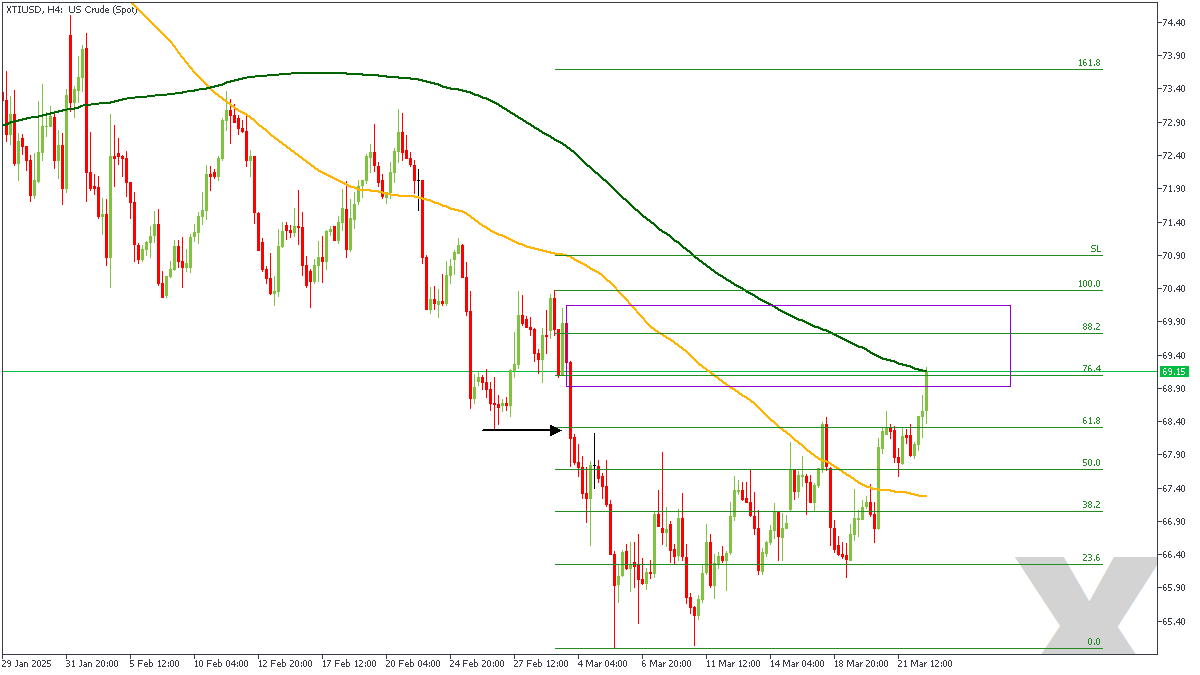
XTIUSD – H4 Timeframe
The price action on the 4-hour timeframe chart of XTIUSD is currently leaning on the 200-period moving average resistance near the 76% Fibonacci retracement level, right in the middle of the rally-base-drop supply. The bearish array of the moving averages is another clue that points to the likelihood of a bearish outcome.
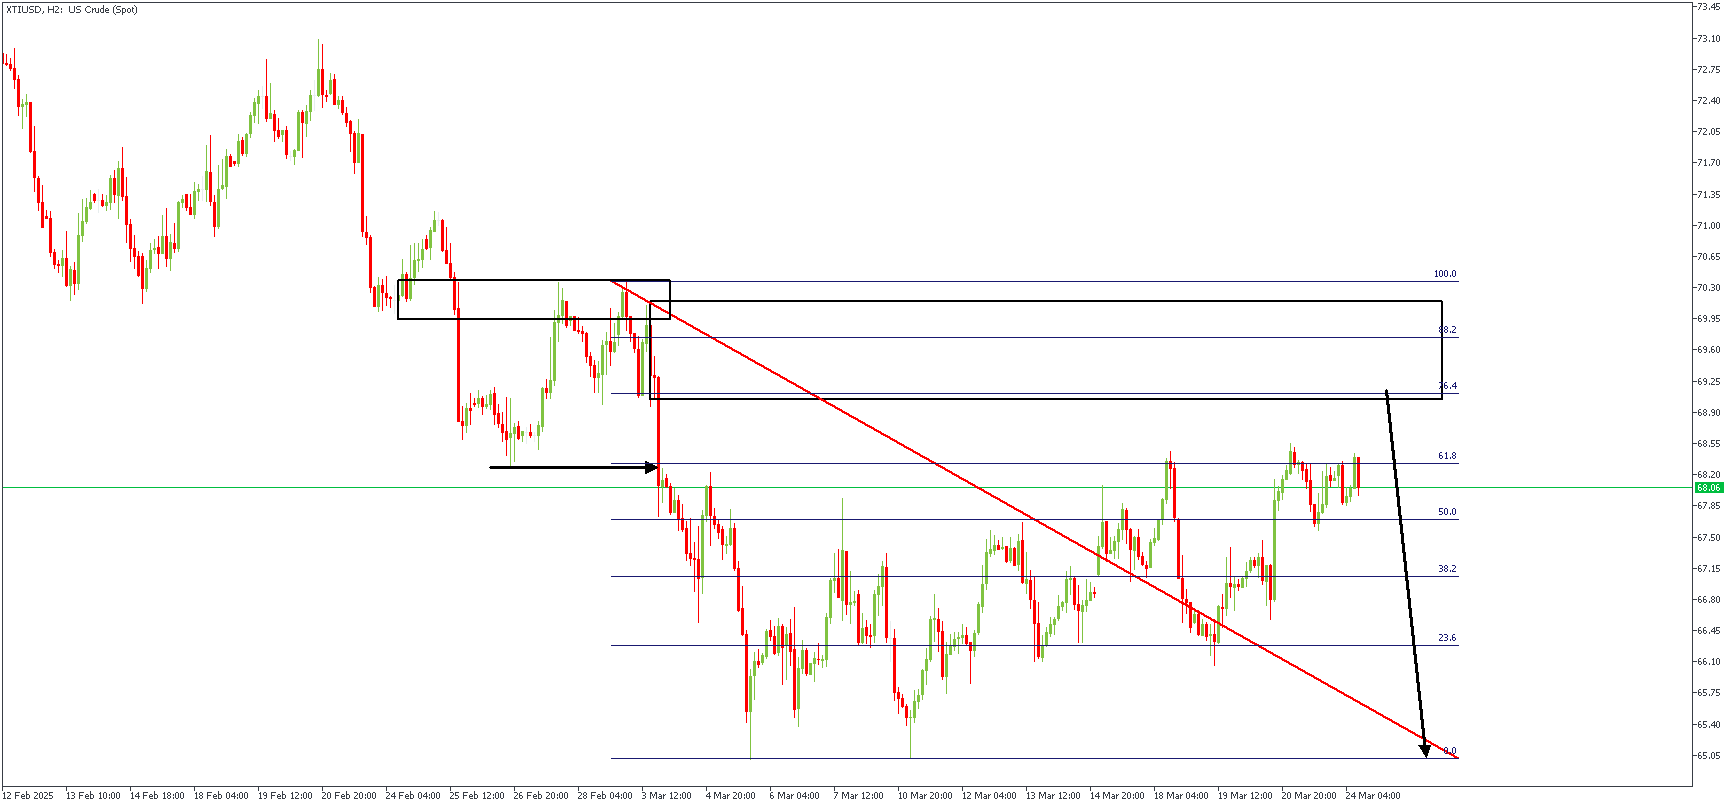
XTIUSD – H2 Timeframe
On the 2-hour timeframe chart of XTIUSD, we see the previous bearish break of structure, the FVG (Fair Value Gap) created by the breakout momentum, and the inducement from the internal structure highs. Comparing this with the higher timeframe sentiment leaves the bearish sentiment as the more probable option.
Analyst’s Expectations:
- Direction: Bearish
- Target- 65.05
- Invalidation- 70.50