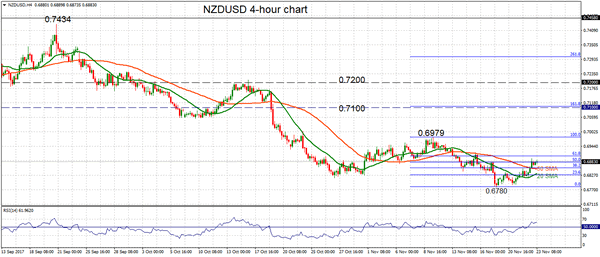
NZDUSD is on a continuous downward trajectory since falling from the September 20 peak of 0.7434, making a series of lower highs and lower lows. The bearish market structure is still in place, although in the near-term prices are pulling back.
Short-term charts are indicating a slight reversal. On the 4-hour chart, there was a corrective bounce off the 5-month low of 0.6780. The market has reached a critical area and is testing a key Fibonacci level. The 50% retracement of the recent downleg from 0.6979 to 0.6780 has been pierced today.
Another leg higher cannot be ruled out since RSI is above 50 and as long as NZDUSD can remain above the 50% Fibonacci in the near-term. The next target to the upside would be the 61.8% Fibonacci level at 0.6904 and the November 9 high of 0.6979. From this point, the outlook appears more bullish with scope to target the key areas at 0.7100 and 0.7200.
Meanwhile, a break below the 50% Fibonacci would target support levels at 0.6856 and 0.6828 ahead of 0.6720. Another extension lower from here would confirm the resumption of the medium-term downtrend.

