
. However, once the price moved above the key 1.3000 level, the upper boundary of the channel appeared out of reach—possibly signalling weakening buying momentum.)
As shown in today’s GBP/USD chart, the pair failed to maintain its position above the psychological level of 1.3000 USD per pound, where it had reached its highest point since early 2025. The decline followed recent central bank decisions and statements, with both the Bank of England and the Federal Reserve keeping interest rates unchanged.
On one side, the Bank of England:
→ Warned of inflation risks, partly driven by external factors such as US trade tariffs.
→ Indicated a potential rate cut in the coming months.
On the other hand, the US dollar strengthened on Thursday after the Federal Reserve signalled reluctance to rush further rate cuts this year, despite uncertainties surrounding US tariffs.
These statements highlighted the challenges market participants face in assessing the risks posed by tariffs on global trade.
Technical Analysis of GBP/USD
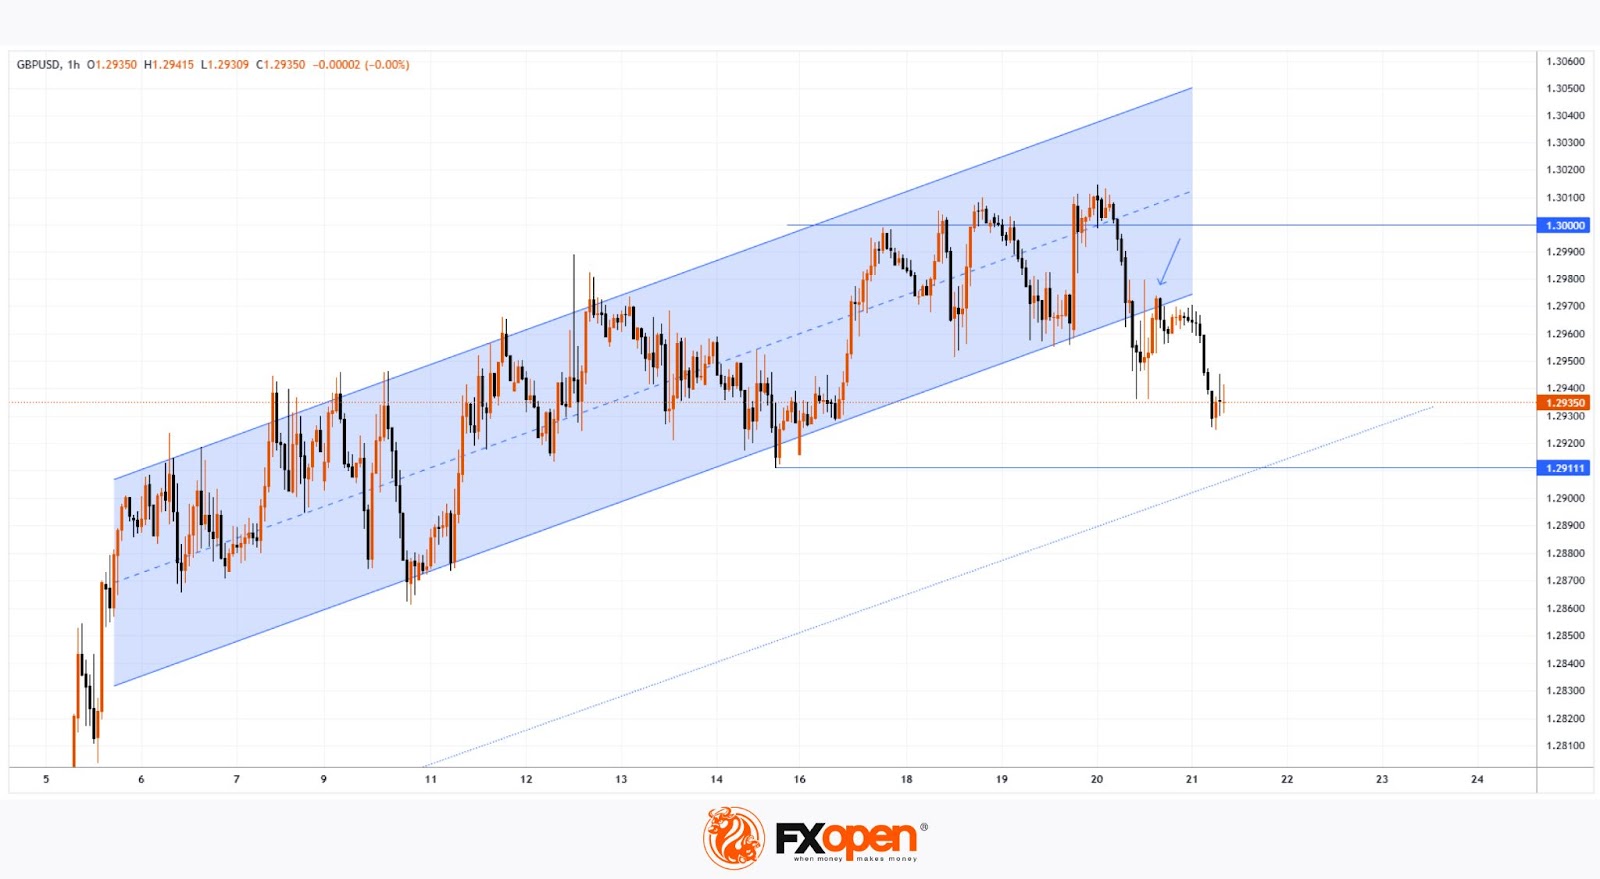
In March, the pound followed an upward trend against the US dollar, forming an ascending channel (marked in blue). However, once the price moved above the key 1.3000 level, the upper boundary of the channel appeared out of reach—possibly signalling weakening buying momentum.
As a result, the price broke below the lower boundary of the channel, which has now shown signs of resistance (indicated by an arrow). If bearish pressure persists, the price could fall towards the dotted trendline below the channel, at a distance equal to its height. Additionally, a test of the previous local low around 1.2911 cannot be ruled out.
Trade over 50 forex markets 24 hours a day with FXOpen. Take advantage of low commissions, deep liquidity, and spreads from 0.0 pips. Open your FXOpen account now or learn more about trading forex with FXOpen.
This article represents the opinion of the Companies operating under the FXOpen brand only. It is not to be construed as an offer, solicitation, or recommendation with respect to products and services provided by the Companies operating under the FXOpen brand, nor is it to be considered financial advice.