
 has followed suit, closing more than 10% below its 19 February peak on Thursday, officially confirming a correction.)
Six days ago, we noted that the Nasdaq 100 had entered a correction phase. Now, the S&P 500 (US SPX 500 mini on FXOpen) has followed suit, closing more than 10% below its 19 February peak on Thursday, officially confirming a correction.
Statistically, according to research by Yardeni Research:
→ Market corrections occur quite frequently—since 1929, the S&P 500 has experienced 56 corrections.
→ Only 22 of those corrections turned into bear markets, defined as a drop of 20% or more from recent record highs.
S&P 500 Analysis: How Long Could This Correction Last?
On one hand, Friday’s market rebound suggests that buyers are stepping in.
On the other hand:
→ US Treasury Secretary Scott Bessent stated on Sunday that there are “no guarantees” the world’s largest economy will avoid a recession. This came just a week after US President Donald Trump refused to rule out such a scenario.
→ The current correction has lasted 22 days so far, whereas historically, the average correction lasts 115 days and results in a 13.8% decline from the peak.
Technical Analysis of the S&P 500 (US SPX 500 mini on FXOpen)
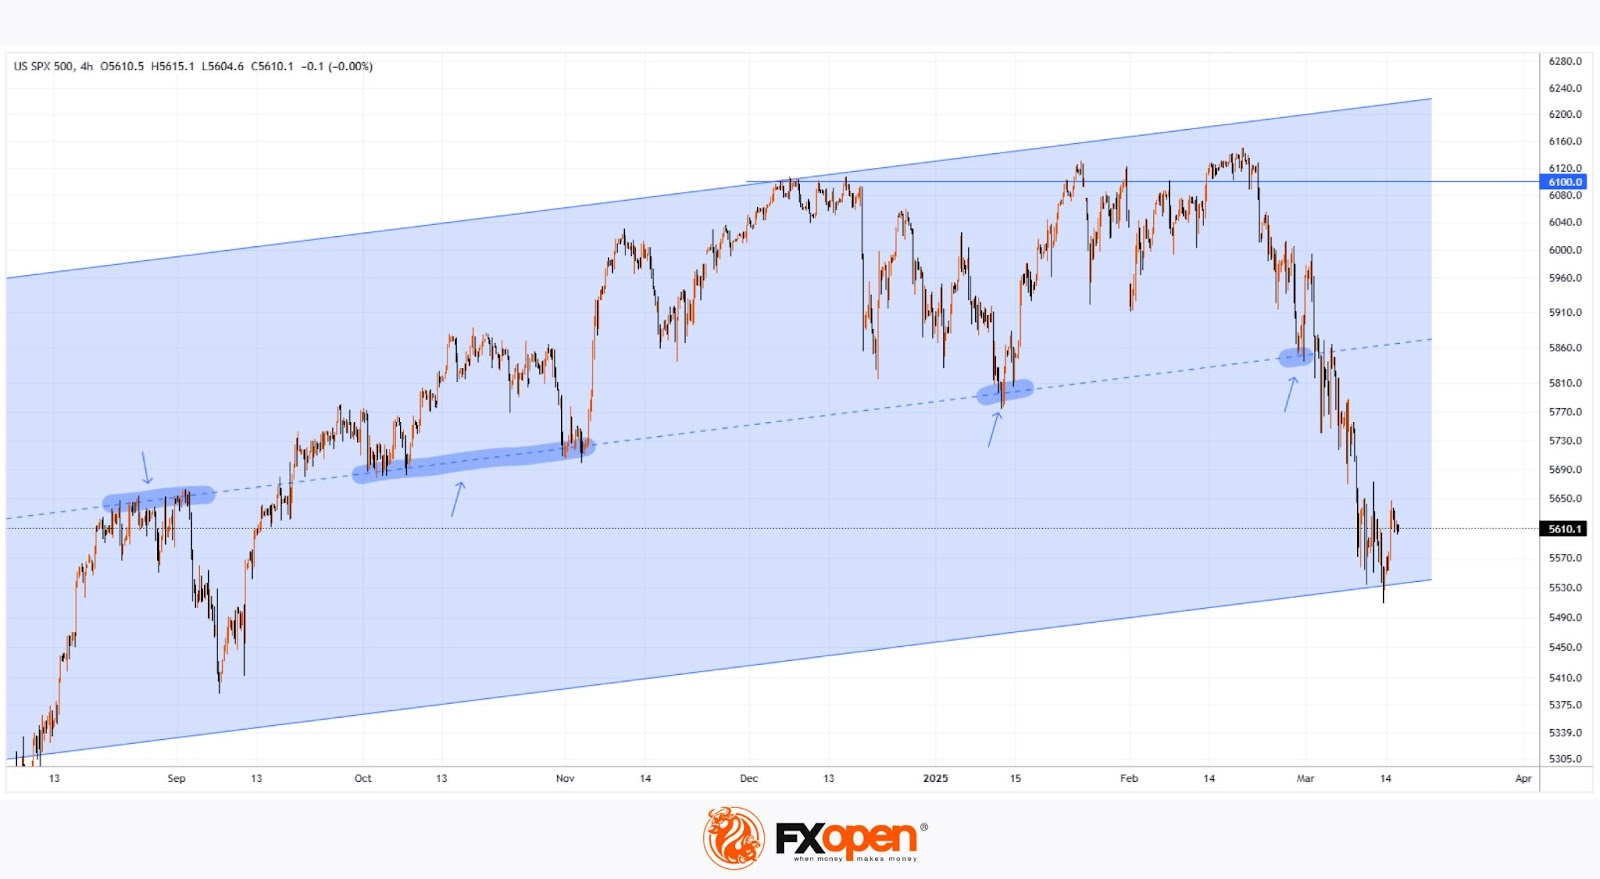
The price is forming an upward channel around the median line, which alternates between acting as support and resistance (marked in blue).
→ Price action suggests that bulls are struggling to hold above the 6,100 level. In February, they failed to push towards the upper boundary of the channel.
→ Since the price has reached the lower boundary of the channel, there is a possibility that bearish momentum may start to weaken.
However, if the price loses support at the lower boundary of the channel, this would be a bearish signal from a technical perspective, indicating the potential for a deeper correction in the S&P 500 (US SPX 500 mini on FXOpen).
Trade global index CFDs with zero commission and tight spreads. Open your FXOpen account now or learn more about trading index CFDs with FXOpen.
This article represents the opinion of the Companies operating under the FXOpen brand only. It is not to be construed as an offer, solicitation, or recommendation with respect to products and services provided by the Companies operating under the FXOpen brand, nor is it to be considered financial advice.