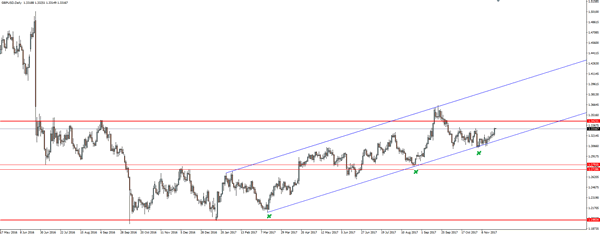
While the GBP/USD horizontal range is clear, the fact that price is following a bullish trend channel higher within it, is hugely significant. Take a look at the daily chart below:
GBP/USD Daily:

The bullish price action in the pair looks to have some momentum behind it and I’m interested to see how price reacts to the horizontal range top resistance.
As you can see on the chart above, price is hitting some short term resistance at the moment, but if that manages to go, momentum could very well see an instant rip up to the 1.34 solid level.
The bullish perspective is the trend channel and bullish momentum, while for the bears, they’re watching the fact that price is fast approaching major horizontal resistance.
