
Key Highlights
- USD/JPY extended losses and traded below the 149.20 support.
- A key bearish trend line is forming with resistance at 149.30 on the 4-hour chart.
- GBP/USD surged above the 1.2800 and 1.2850 resistance levels.
- The US nonfarm payrolls could change by 160K in Feb 2025.
USD/JPY Technical Analysis
The US Dollar remained in a bearish zone below 150.00 against the Japanese Yen. USD/JPY extended losses below 149.20 to move further in a bearish zone.
Looking at the 4-hour chart, the pair settled below the 149.20 level, the 100 simple moving average (red, 4-hour), and the 200 simple moving average (green, 4-hour). The pair even dived below the 148.50 support zone.
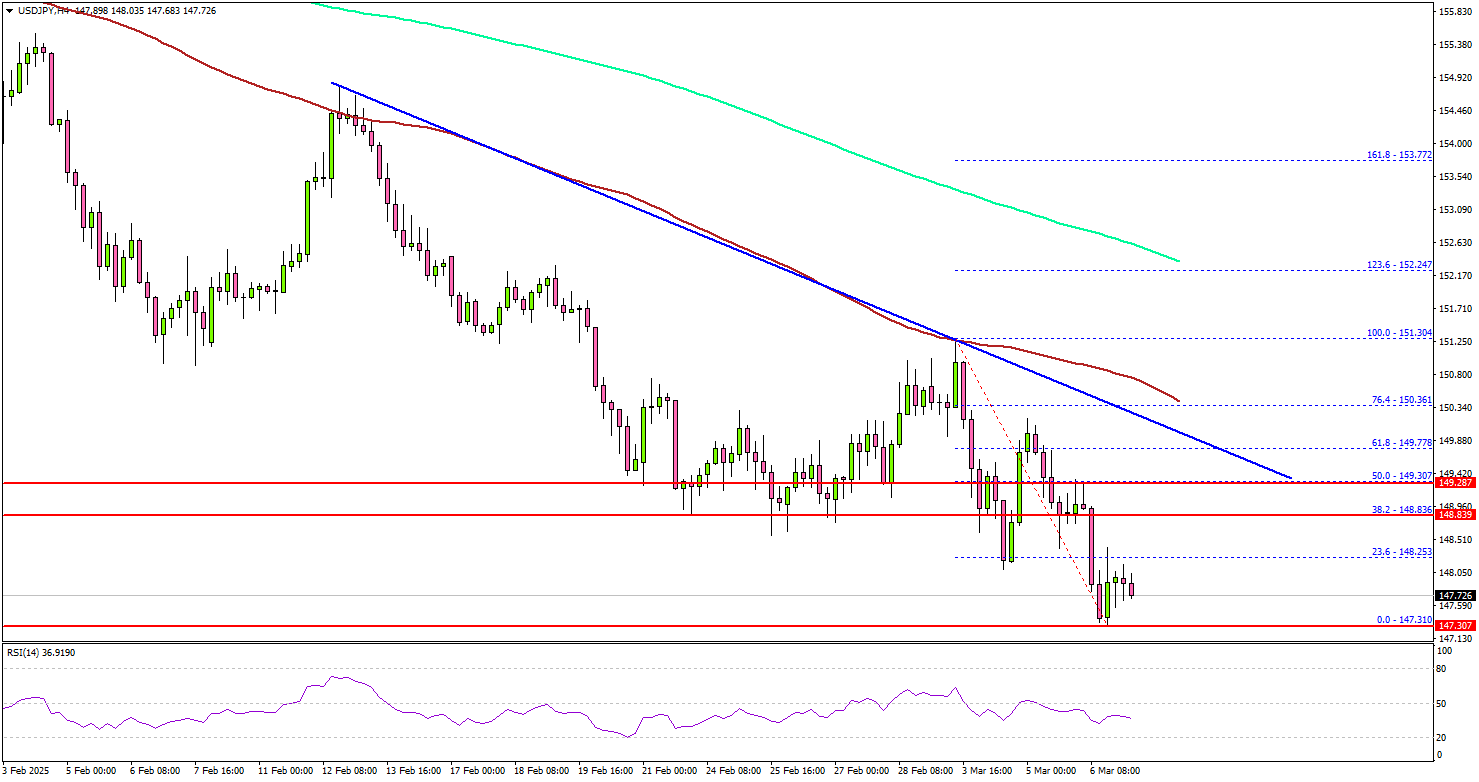
It tested the 147.30 zone. On the downside, immediate support sits near the 147.20 level. The next key support sits near the 146.50 level. Any more losses could send the pair toward the 145.00 level.
On the upside, the pair seems to be facing hurdles near the 148.25 level. The next major resistance is near the 148.50 level. The main resistance is now forming near the 149.20 zone. There is also a key bearish trend line forming with resistance at 149.30 on the same chart.
A close above the 149.30 level could set the tone for another increase. In the stated case, the pair could even clear the 150.00 resistance.
Looking at GBP/USD, the pair also started a decent increase and the pair even cleared the 1.2850 resistance zone.
Upcoming Economic Events:
- US nonfarm payrolls for Feb 2025 – Forecast 160K, versus 143K previous.
- US Unemployment Rate April 2025 – Forecast 4.0%, versus 4.0% previous.