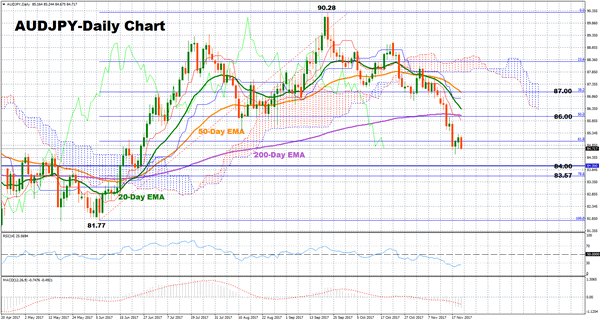
AUDJPY followed a downtrend after it posted a two-year high at 90.28 in September, going all the way down to a five-month low of 84.74 and crossing below the Ichimoku cloud and the exponential moving average lines (EMA). Risk to the downside remains in the short and medium-term according to technical indicators.
The pair is currently bearish and is likely to extend its downleg in the short-term. The RSI is also located in bearish territory below 50 but has entered oversold area for the first time since April, hinting that the price might move to the upside for a while before it resumes its downtrend (In the 1-hour chart, RSI is bearish but points to the upside).
If prices continue to fall, an immediate support is likely to emerge at the 84.00 psychological level, which has been approached as a resistance in the past. From here, the pair would see the 78.6% Fibonacci at 83.57 before it targets the six-month low at 81.77.
Otherwise, the pair would find a strong resistance at the 50% Fibonacci at 86.00, meeting the 50-day EMA as well. Any violation of this point would accelerate upside momentum towards the 50-day EMA and the 38.2% Fibonacci of 87.00. This would shift the short-term bias from bearish to neutral. Steeper increases could also meet the two-year high of 90.28.
Turning to medium-term outlook, the pair is bearish given that it is trading below the 200-day EMA. MACD gives another bearish evidence as it is negative below its signal line.
In the bigger picture, though, the pair is bullish to neutral as the bullish cross between the 200-day EMA and the 50-day EMA is still intact but the 50-day EMA is negatively sloping while the 200-day EMA has flattened.

