The US Dollar (USD) is slightly stronger today, but gains against major currencies are limited, and most currencies stay within their established ranges. European stocks are down slightly, while US stock futures look better. Bond markets are weaker, with Treasury yields rising by 4-5bps. The Japanese Yen (JPY) and Swiss Franc (CHF) are underperforming, while the Mexican Peso (MXN) and Canadian Dollar (CAD) are doing better, possibly due to uncertainty over President Trump’s tariff deadlines. Month-end demand may support the USD, but it’s struggling to make significant gains. Technical trends have weakened slightly, with the USD Index (DXY) trading below its 100-day moving average. The market is also sensitive to weak US economic data, like the recent drop in Consumer Confidence.
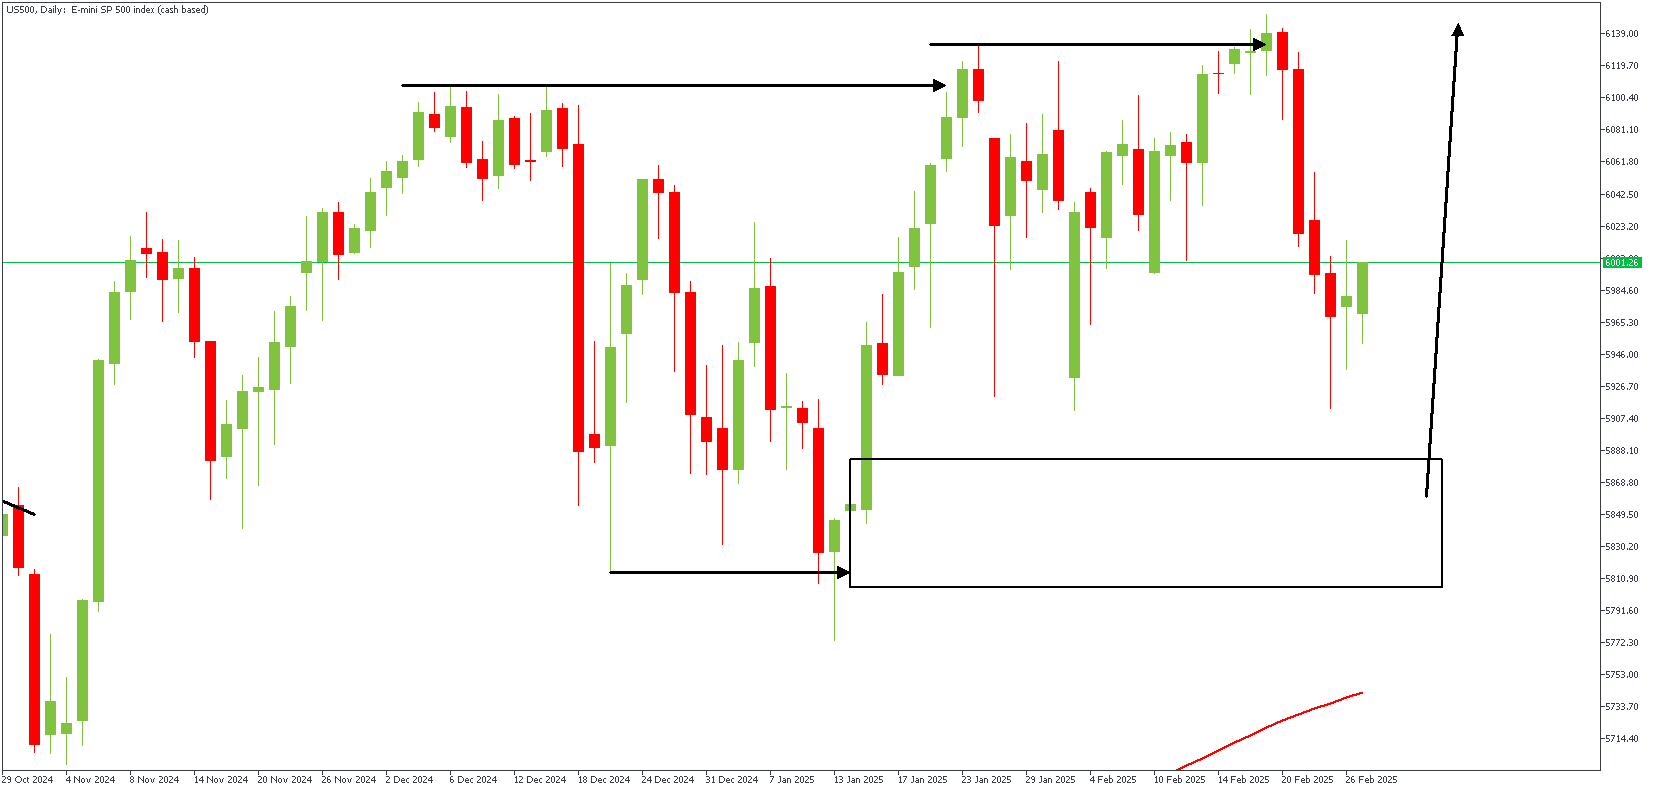
US500 – D1 Timeframe
On the daily timeframe chart of US500, we see the initial liquidity sweep from the highlighted low right before the price broke above the previous high. The drop-base-rally demand zone at the trough of the SBR pattern is situated near the 76% Fibonacci retracement level, increasing the likelihood of a bullish reaction.
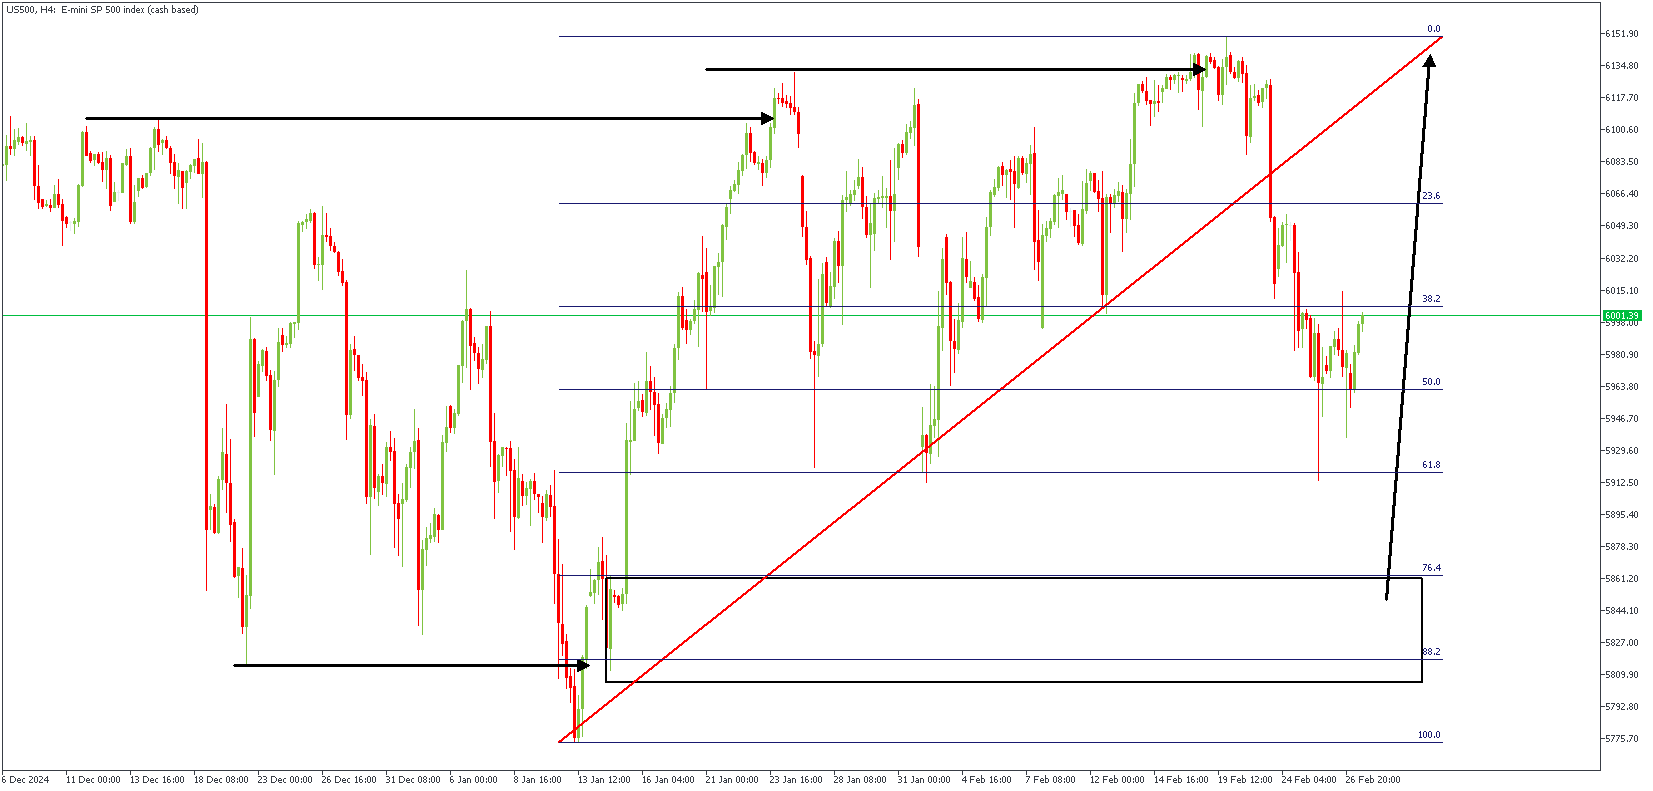
US500 – H4 Timeframe
The FVG (Fair Value Gap) left behind by the structure’s double break needs to be filled, as hinted by the presence of liquidity at the equal lows on the 4-hour timeframe chart of US500. These serve as a confluence in favor of the bullish sentiment, and given the Fibonacci retracement factor in the equation, there is a high chance the outcome is bullish.
Analyst’s Expectations:
- Direction: Bullish
- Target- 6144.04
- Invalidation- 5771.95