
As shown on the XAU/USD chart, the price of gold per ounce has already fallen by more than 1% today. This bearish sentiment may be driven by:
→ A strengthening US dollar, influenced by President Trump’s plans to impose international trade tariffs.
→ Market positioning ahead of key US economic data releases, including GDP growth figures and the Core PCE Price Index.
→ A sharp decline in China’s gold imports via Hong Kong—the country’s main gateway for bullion purchases—which fell to a near three-year low in January.
Technical Analysis of XAU/USD Chart
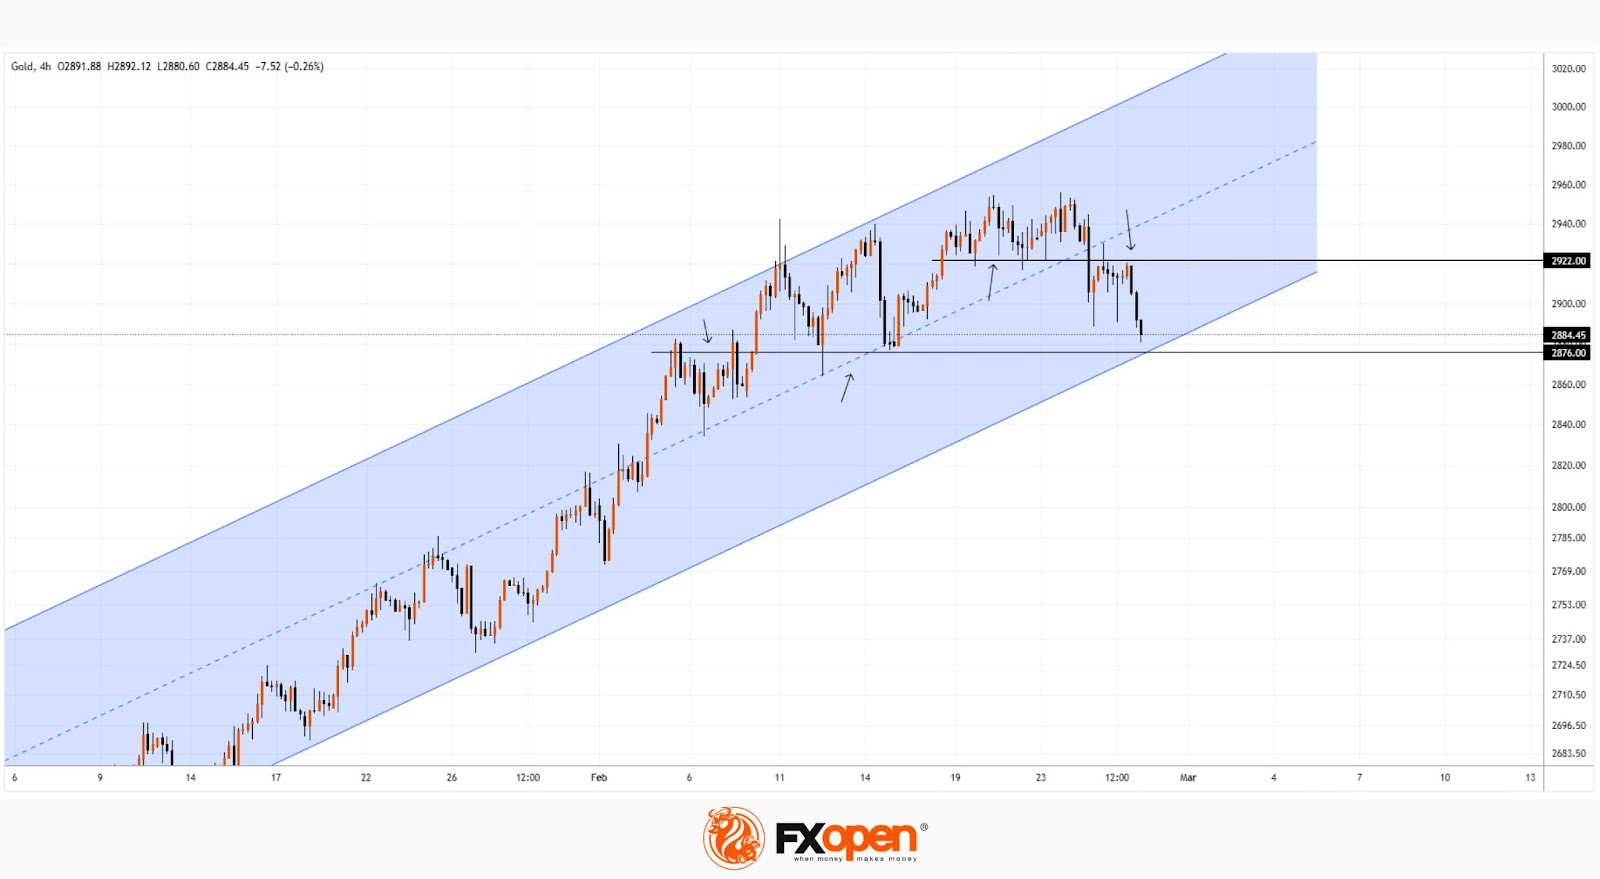
Gold price fluctuations have formed an upward trend channel, marked in blue, with the current decline bringing the price close to its lower boundary.
Key levels to watch:
→ $2,922 has shifted from support to resistance.
→ $2,876, which previously acted as resistance, may now serve as a support level.
Given these factors, the intersection of the lower boundary of the blue channel and the $2,876 support level could trigger a rebound, offsetting some of the bearish momentum seen so far.
Start trading commodity CFDs with tight spreads. Open your trading account now or learn more about trading commodity CFDs with FXOpen.
This article represents the opinion of the Companies operating under the FXOpen brand only. It is not to be construed as an offer, solicitation, or recommendation with respect to products and services provided by the Companies operating under the FXOpen brand, nor is it to be considered financial advice.