The Pound Sterling (GBP) strengthens against most currencies but edges lower against the US Dollar (USD), trading near 1.2660. Bank of England’s Dhingra predicts more than four interest rate cuts this year, adding to market uncertainty. The USD rebounds as US Treasury yields rise, with 10-year yields recovering to 4.33% after hitting a two-month low of 4.28%. The US Dollar Index (DXY) also bounces back after touching an 11-week low of 106.10 earlier in the day. Investors are now looking ahead to the US PCE inflation data for January, which is set for release on Friday. The US administration’s approval of a $4.5 trillion tax cut plan further supports the USD.
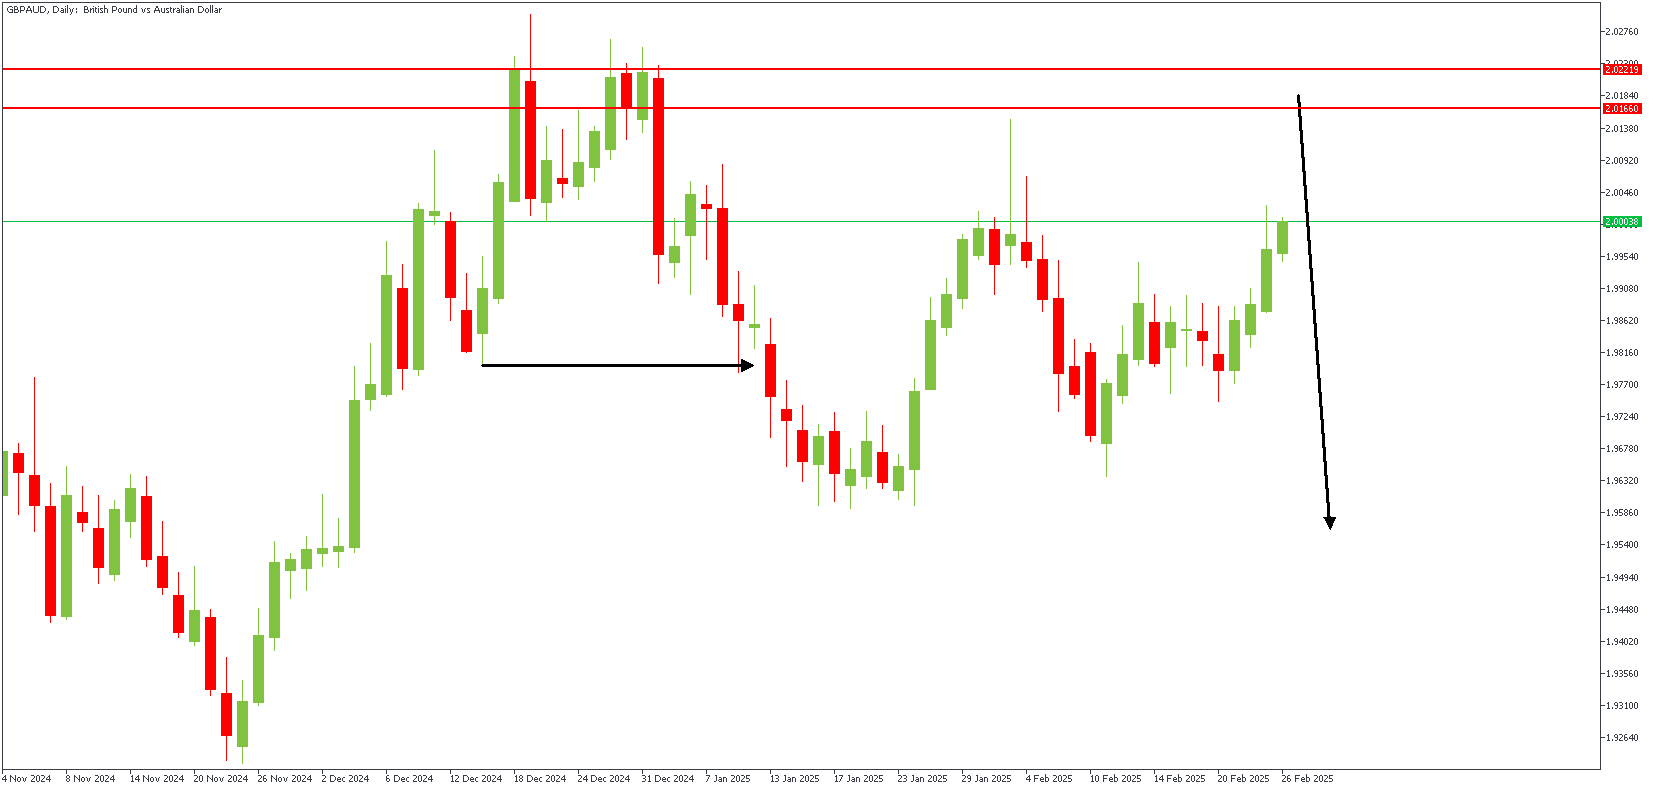
GBPAUD – D1 Timeframe
The previous bearish swing’s failure to break below the last low on the daily timeframe chart of GBPAUD renders the recent high a liquidity sweet spot. As a result, the price is expected to raid this liquidity area before reacting to the supply region. The overall sentiment here is bearish.
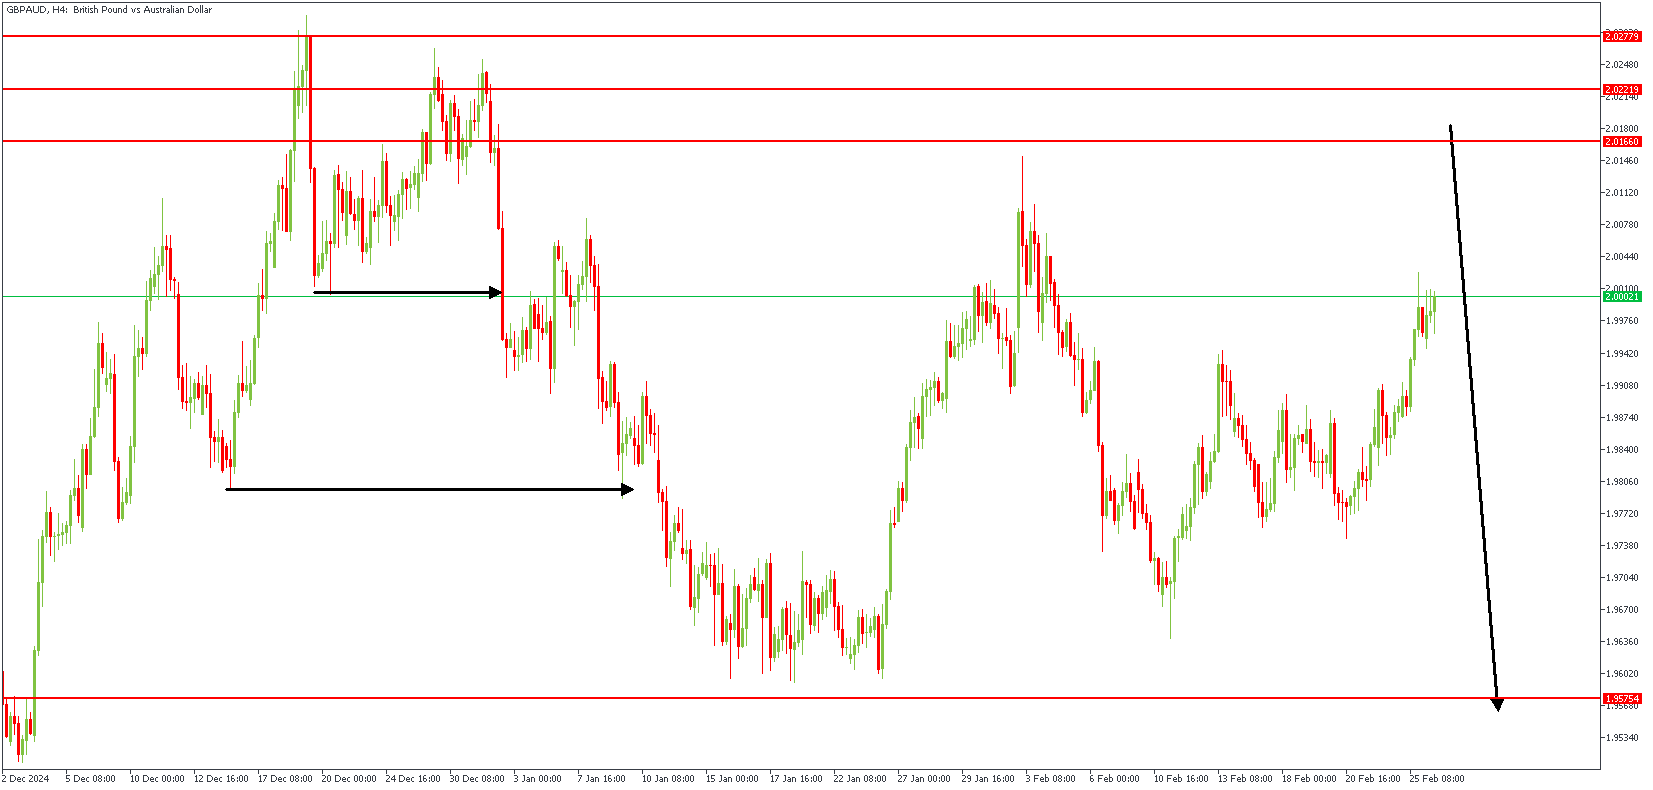
GBPAUD – H4 Timeframe
The price action on the 4-hour timeframe chart of GBPAUD reveals that the highlighted supply area overlaps the daily timeframe pivot zone, with an FVG just before the supply zone. The double bearish break of structure to the left of the chart further affirms the higher timeframe bearish sentiment.
Analyst’s Expectations:
- Direction: Bearish
- Target- 1.96650
- Invalidation- 2.03084