
Bank of Canada (BoC) Governor Macklem has recently said the economy is improving due to stronger consumer demand but warned that a trade war with the US could cause serious harm. He estimated that such a conflict could shrink Canada’s economy by nearly 3% over two years and lower long-term growth by 2.5%. Macklem emphasized that the situation is uncertain, and the BoC will adjust its policy as needed at the 12th Mar. meeting. The Canadian Dollar (CAD) weakened last week, particularly against the Japanese Yen (JPY), falling below 105 to its lowest level since last September. This drop broke a key support level, suggesting the CAD could decline further. Diverging policies between the BoC and Bank of Japan (BoJ) and trade tensions may continue to pressure the CAD.
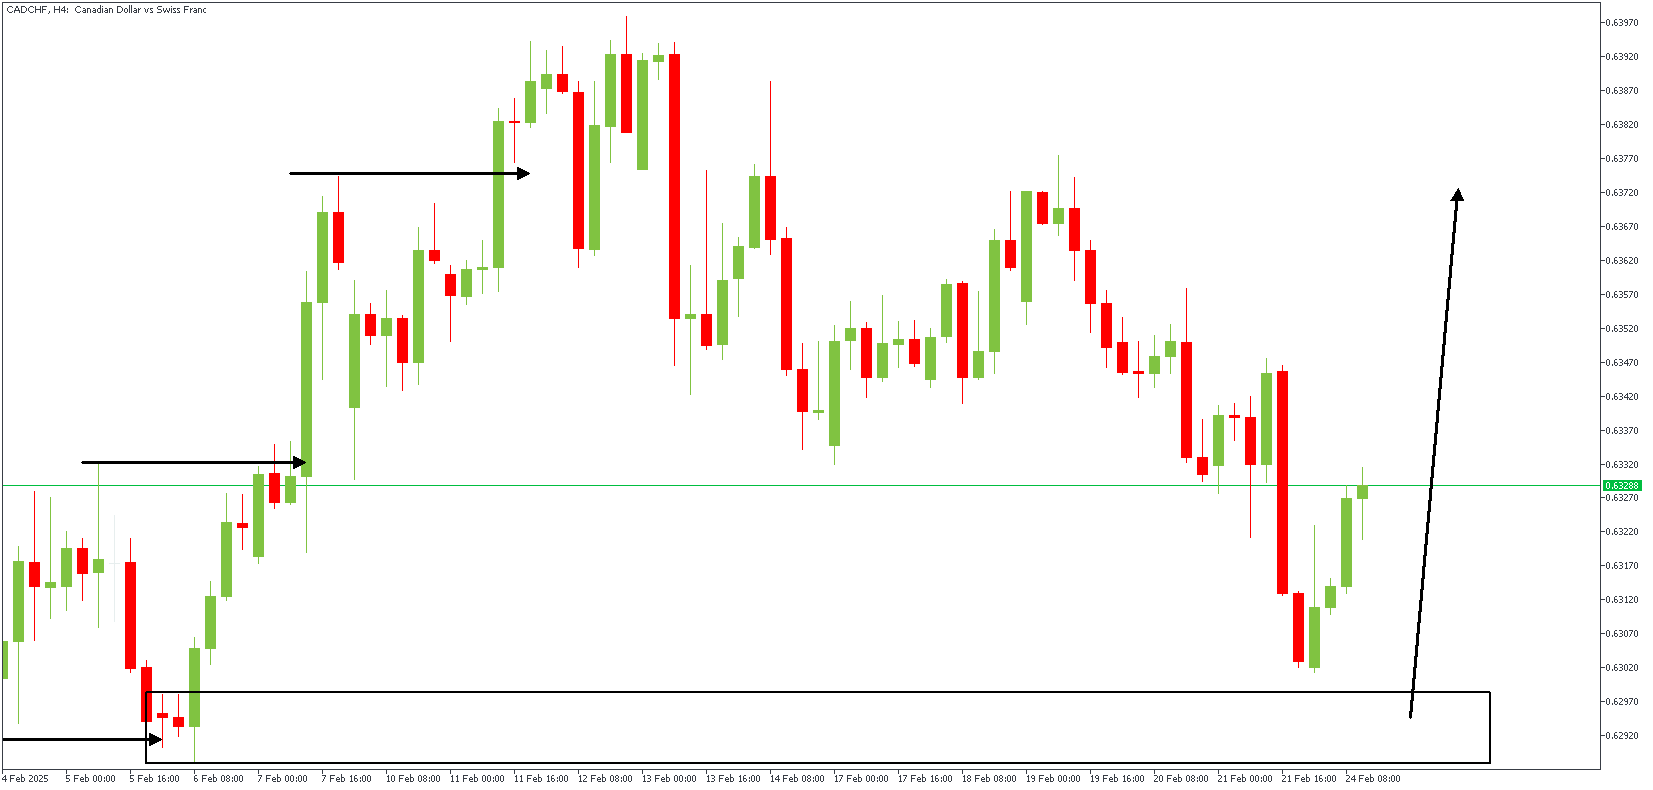
CADCHF – H4 Timeframe
The price action on the 4-hour timeframe chart of CADCHF has recently been rejected off the demand zone at the origin of a double break of structure pattern. This has led to a reversal in the initial bearish momentum, thus implying a change in the trend. At present, the bullish impulse is expected to push prices to create a new higher high.
CADCHF – H3 Timeframe
The 3-hour timeframe chart of CADCHF shows a more detailed presentation of the double break of structure pattern, showing the swept low, the initial high, and the induced high. Such price behavior often confirms a change in the character of the market sentiment.
Analyst’s Expectations:
- Direction: Bullish
- Target- 0.63786
- Invalidation- 0.62807
