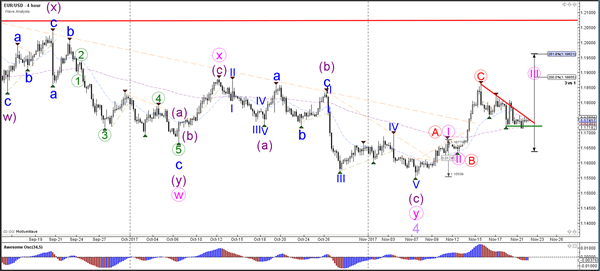
Currency pair EUR/USD
EUR/USD is in between key support (green) and resistance (red) trend lines. A break below support indicatesthat an ABC (orange) pattern is more likely than a 123 (pink) pattern whereas a bullish breakout could be part of the wave 3 (pink).
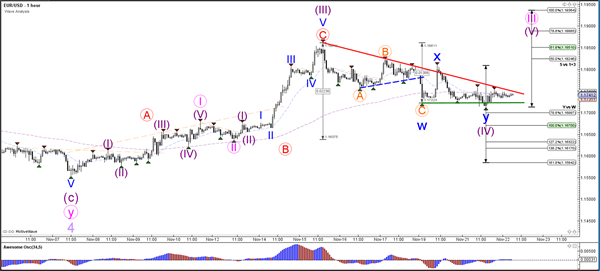
The EUR/USD potential breakout aboveresistance (red) could indicate a continuation of the uptrend within a wave 5 (purple) of wave 3 (pink). A push below makes a wave 4 less likely and could indicate a bearish continuation towards the targets of wave Y (blue).
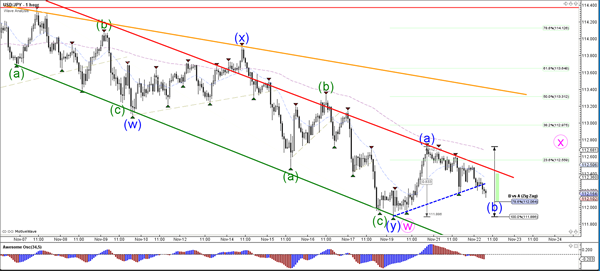
Currency pair USD/JPY
The USD/JPY remains in the bearish channel. A bullish break above that resistance could see price challenge the 38.2, 50% Fibs and shallower trend line (orange) whereas a bearish continuation could target the 50% Fib of wave 2 or B (light purple).
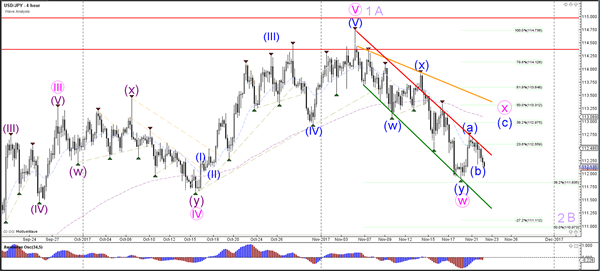
The USD/JPY could expand the wave X (pink) via an ABC zigzag (blue), although this scenario becomes less likely as price is breaking below the support trend lines (blue). Price still needs to break below the Fibs of wave B (blue).
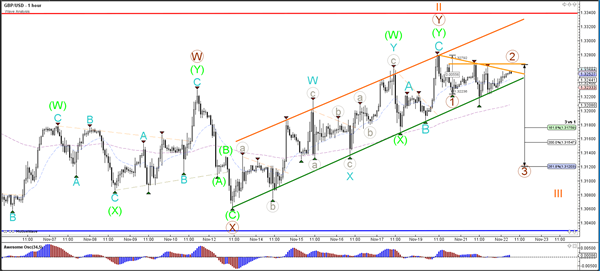
Currency pair GBP/USD
The GBP/USDremains in the bullish channel (red/green) within the larger sideways range (red/blue). A breakout above the higher resistance (red) or below the support (blue) is needed before a new trend can be expected.
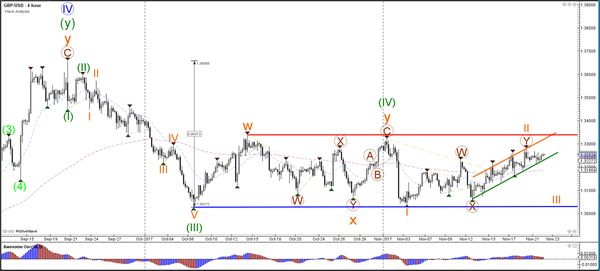
The GBP/USD is building a bearish wave 1-2 (brown) if price manages to break below support (green). A break above resistance (orange) could see price test the bigger resistance (red).