
Key Highlights
- USD/JPY failed to clear the 154.80 resistance zone.
- A key bearish trend line is forming with resistance at 154.80 on the 4-hour chart.
- EUR/USD is rising and might test the 1.0520 resistance zone.
- Gold prices are again rising and might aim for a move above the $2,950 level.
USD/JPY Technical Analysis
The US Dollar started a recovery wave above the 154.00 level against the Japanese Yen. USD/JPY struggled to continue higher above 154.80 and dipped.
Looking at the 4-hour chart, the pair peaked at 154.88 and is currently correcting gains. There was a move below the 153.50 and 153.20 levels. The pair even declined below the 50% Fib retracement level of the upward move from the 150.92 swing low to the 154.88 high.
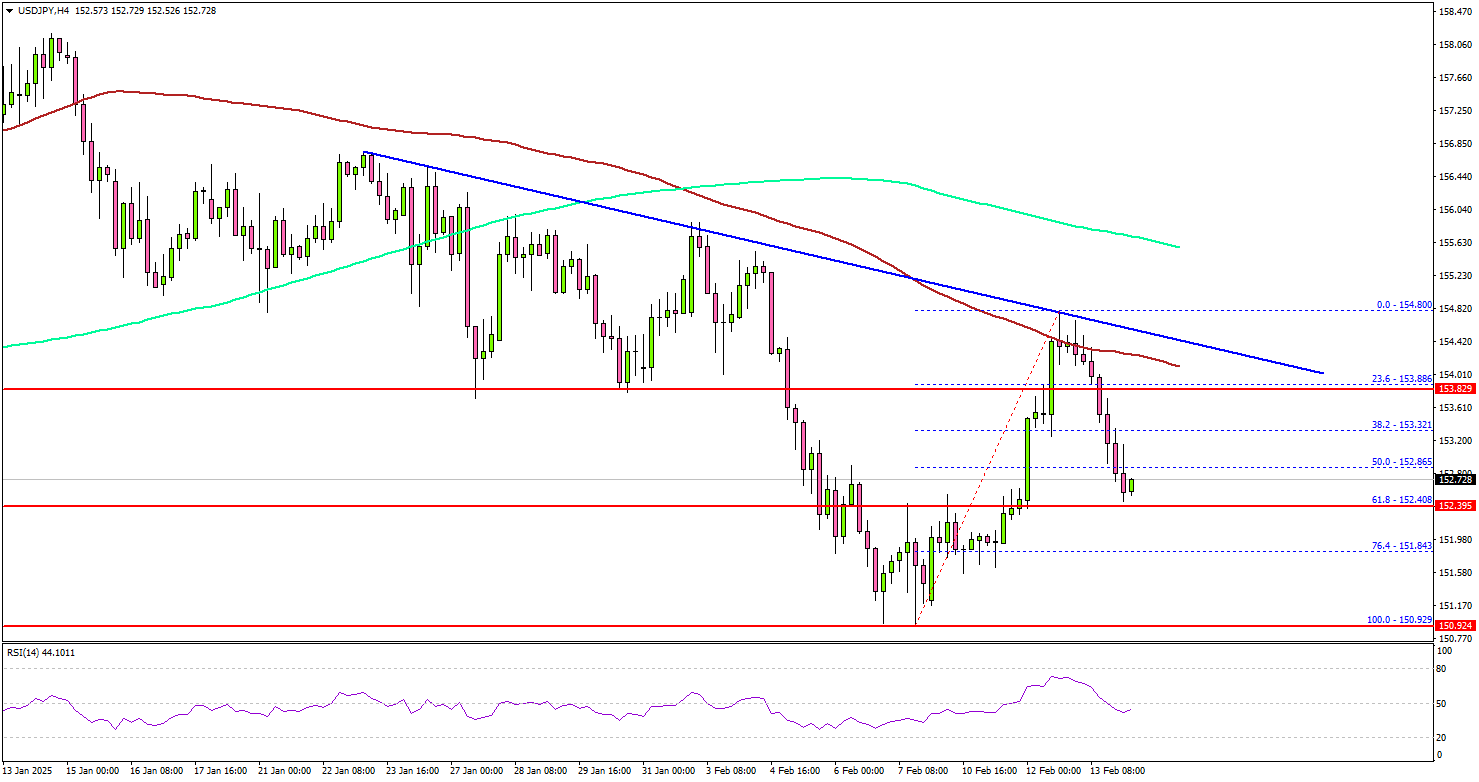
The pair is now showing bearish signs below the 100 simple moving average (red, 4-hour) and the 200 simple moving average (green, 4-hour). There is also a key bearish trend line forming with resistance at 154.80 on the same chart.
On the downside, immediate support sits near the 152.40 level. It is near the 61.8% Fib retracement level of the upward move from the 150.92 swing low to the 154.88 high. The next key support sits near the 151.80 level. Any more losses could send the pair toward the 150.50 level.
On the upside, the pair seems to be facing hurdles near the 153.80 level. The next major resistance is near the 154.50 level. The main resistance is now forming near the 154.80 zone.
A close above the 154.80 level could set the tone for another increase. In the stated case, the pair could even clear the 155.50 resistance.
Looking at EUR/USD, the pair remained stable and might aim for more gains above the 1.0500 level in the near term.
Upcoming Economic Events:
- US Retail Sales for Jan 2025 (MoM) – Forecast -0.1%, versus +0.4% previous.