
Key Highlights
- Gold started a fresh surge above the $2,900 resistance and traded to a new record high.
- A key bullish trend line is forming with support at $2,855 on the 4-hour chart.
- Bitcoin is struggling to clear the $100,000 resistance zone.
- The US Consumer Price Index could rise 2.9% in Jan 2025 (YoY).
Gold Price Technical Analysis
Gold prices started a fresh rally above the $2,850 resistance. The bulls pumped the price above the $2,900 level and the price traded to a new record high.
The 4-hour chart of XAU/USD indicates that the price traded as high as $2,942. It settled well above the 100 Simple Moving Average (red, 4 hours) and the 200 Simple Moving Average (green, 4 hours).
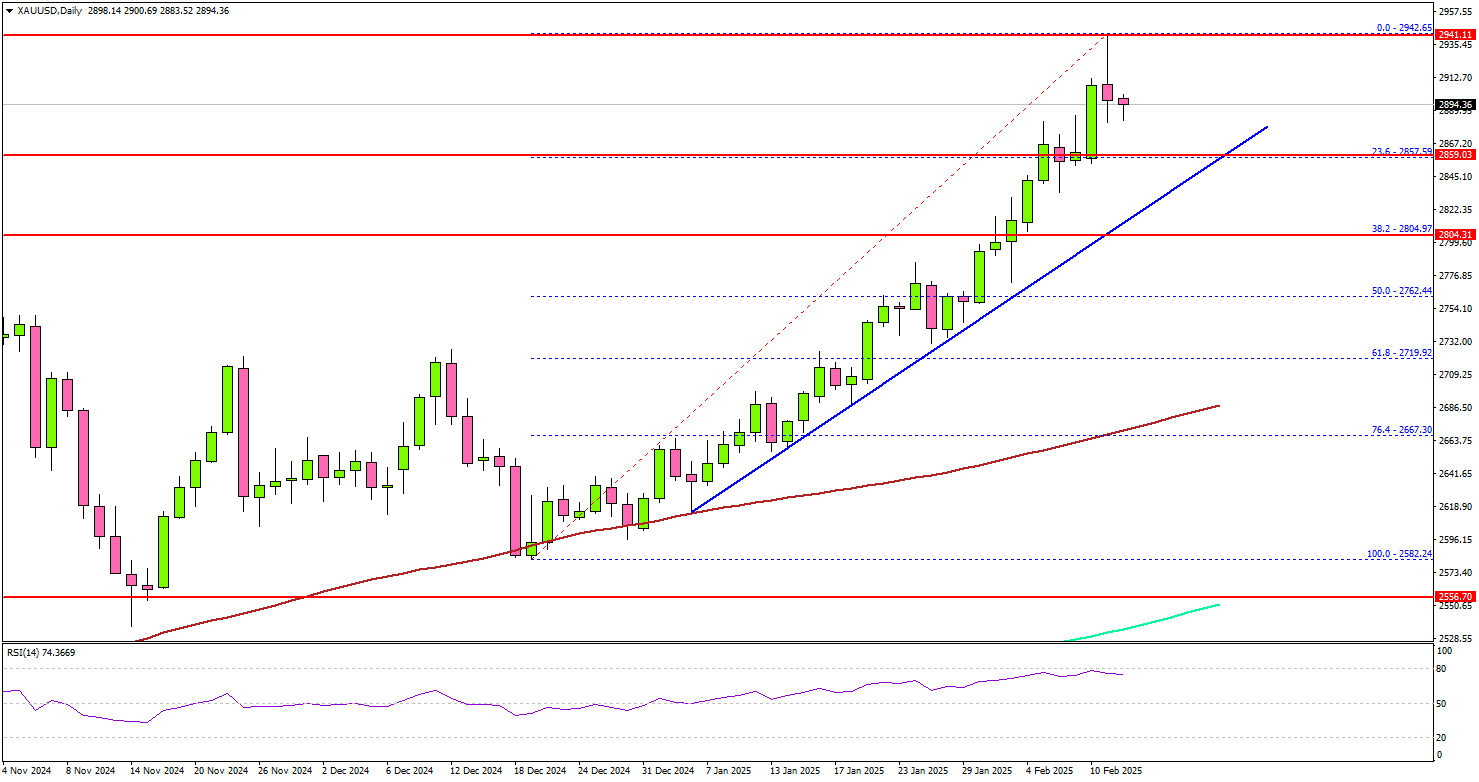
The current price action is bullish and indicates chances of more upsides. On the upside, immediate resistance is near the $2,940 level. The next major resistance sits near the $2,955 level.
A clear move above the $2,955 resistance could open the doors for more upsides. The next major resistance could be $2,980, above which the price could rally toward the milestone level at $3,000.
On the downside, initial support is near the $2,865 level. The first key support is near $2,855. There is also a key bullish trend line forming with support at $2,855 on the same chart. The next major support is near the $2,820 level.
The main support is now $2,805. A downside break below the $2,805 support might call for more downsides. The next major support is near the $2,740 level.
Looking at Bitcoin, the price attempted a recovery wave but the bears are still active below the $100,000 level.
Economic Releases to Watch Today
- US Consumer Price Index for Jan 2025 (MoM) – Forecast +0.3%, versus +0.4% previous.
- US Consumer Price Index for Jan 2025 (YoY) – Forecast +2.9%, versus +2.9% previous.
- US Consumer Price Index Ex Food & Energy for Jan 2025 (YoY) – Forecast +3.1%, versus +3.2% previous.