The AUDUSD pair is holding steady, with key support at 0.6087—its lowest level this year. If it drops below this, it could fall further to 0.6000, while resistance is around 0.6330 and 0.6549. The Relative Strength Index (RSI) suggests some buying interest, but the Average Directional Index (ADX) signals that the current trend may weaken. The Australian Dollar has gained ground as the US Dollar weakens, despite ongoing trade tensions between the US and China, which could impact Australia’s exports. For further economic clues, traders will watch Australia’s upcoming home loan data (12th Feb.) and inflation expectations (14th Feb.).
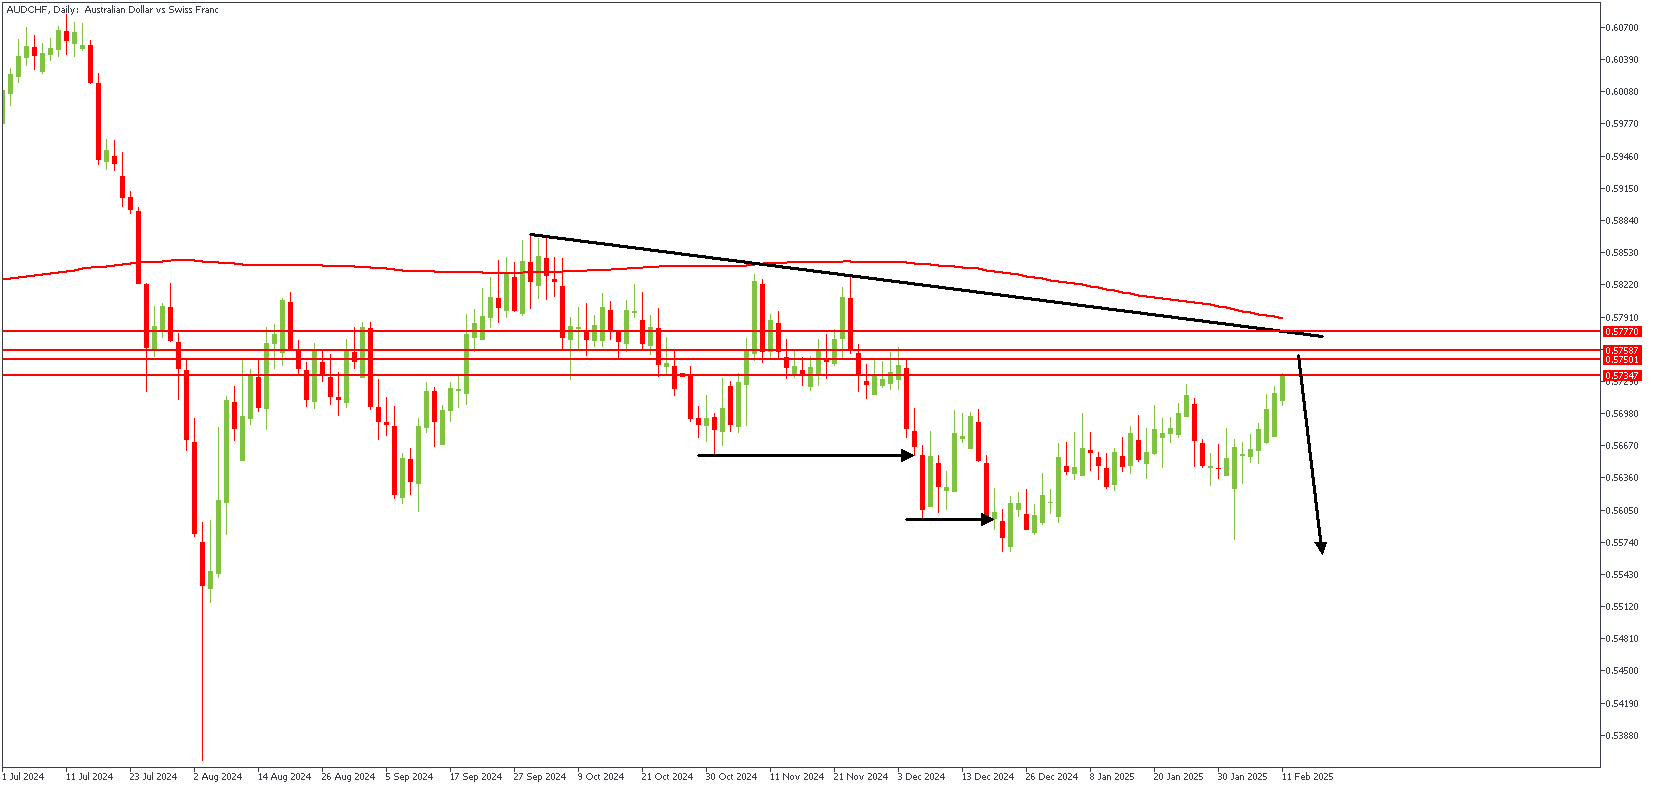
AUDCHF – D1 Timeframe
On the daily timeframe chart of AUDCHF, we see price currently approaching the trendline resistance and the pivot region. Interestingly, the supply region is nearby, thus increasing the likelihood of a bearish reaction from the highlighted zone.
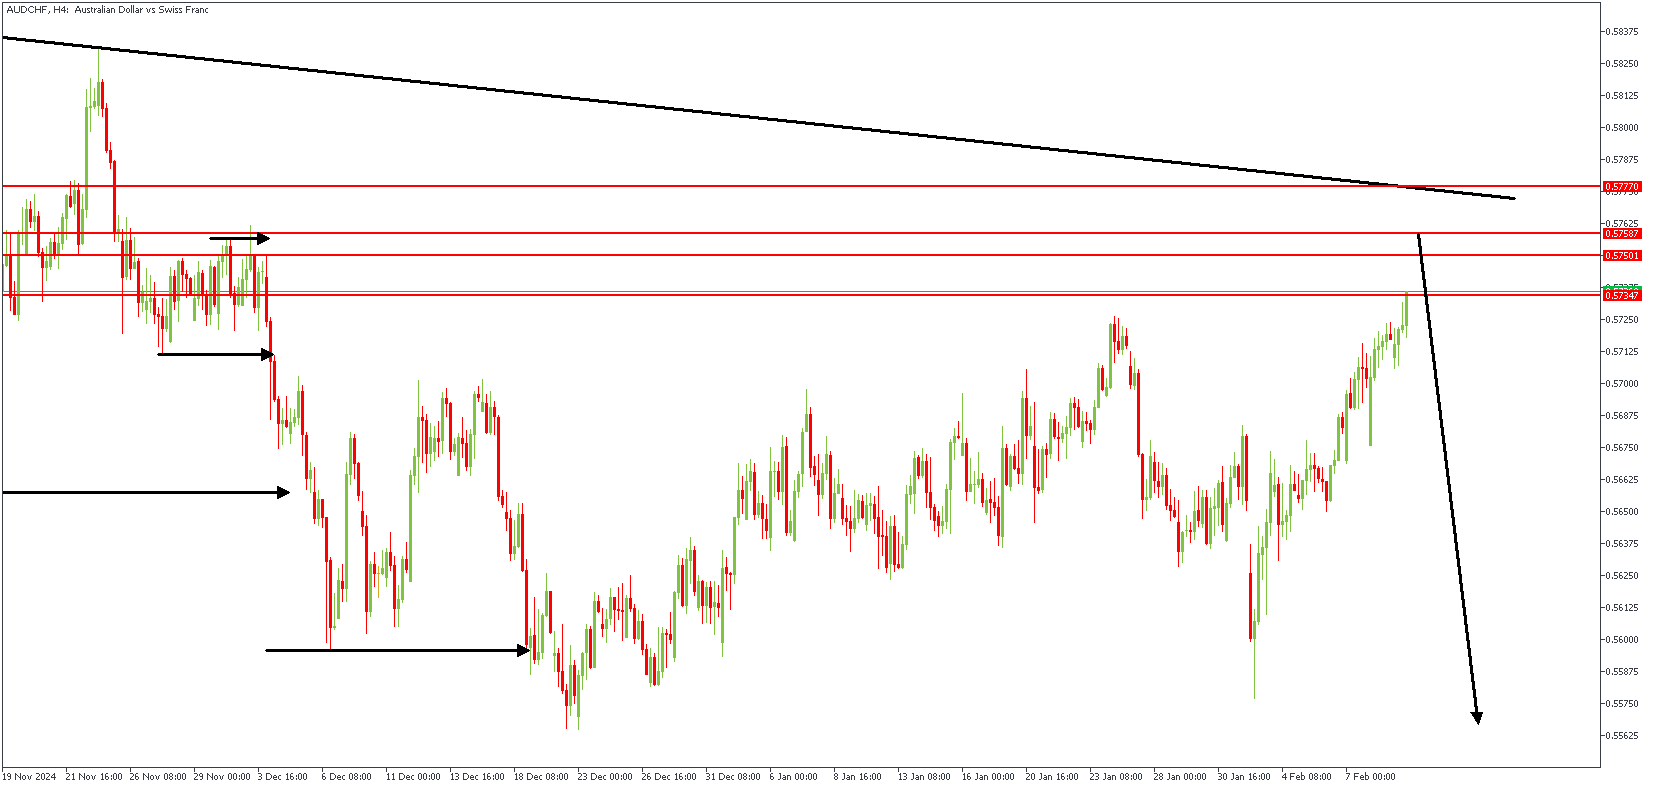
AUDCHF – H4 Timeframe
The 4-hour timeframe chart shows the supply zone more evident, with expectations of a sweep of liquidity and a Fair Value Gap entry. With these confluences aligning with the daily timeframe sentiment, there’s sufficient argument for a bearish outcome.
Analyst’s Expectations:
- Direction: Bearish
- Target: 0.55875
- Invalidation: 0.57841