
Key Highlights
- Bitcoin price started a recovery wave from the $91,350 zone.
- BTC is facing hurdles near a key bearish trend line with resistance at $103,000 on the 4-hour chart.
- Ethereum price also recovered and now faces hurdles near $3,000.
- Gold rallied above the $2,850 and $2,860 resistance levels.
Bitcoin Price Technical Analysis
Bitcoin price started a recovery wave above $95,000 against the US Dollar. BTC was able to surpass the $96,500 and $97,000 resistance levels.
Looking at the 4-hour chart, the price was able to trade above the 50% Fib retracement level of the downward move from the $106,380 swing high to the $91,352 low. The bulls even pushed the price above the $100,000 level before the bears appeared.
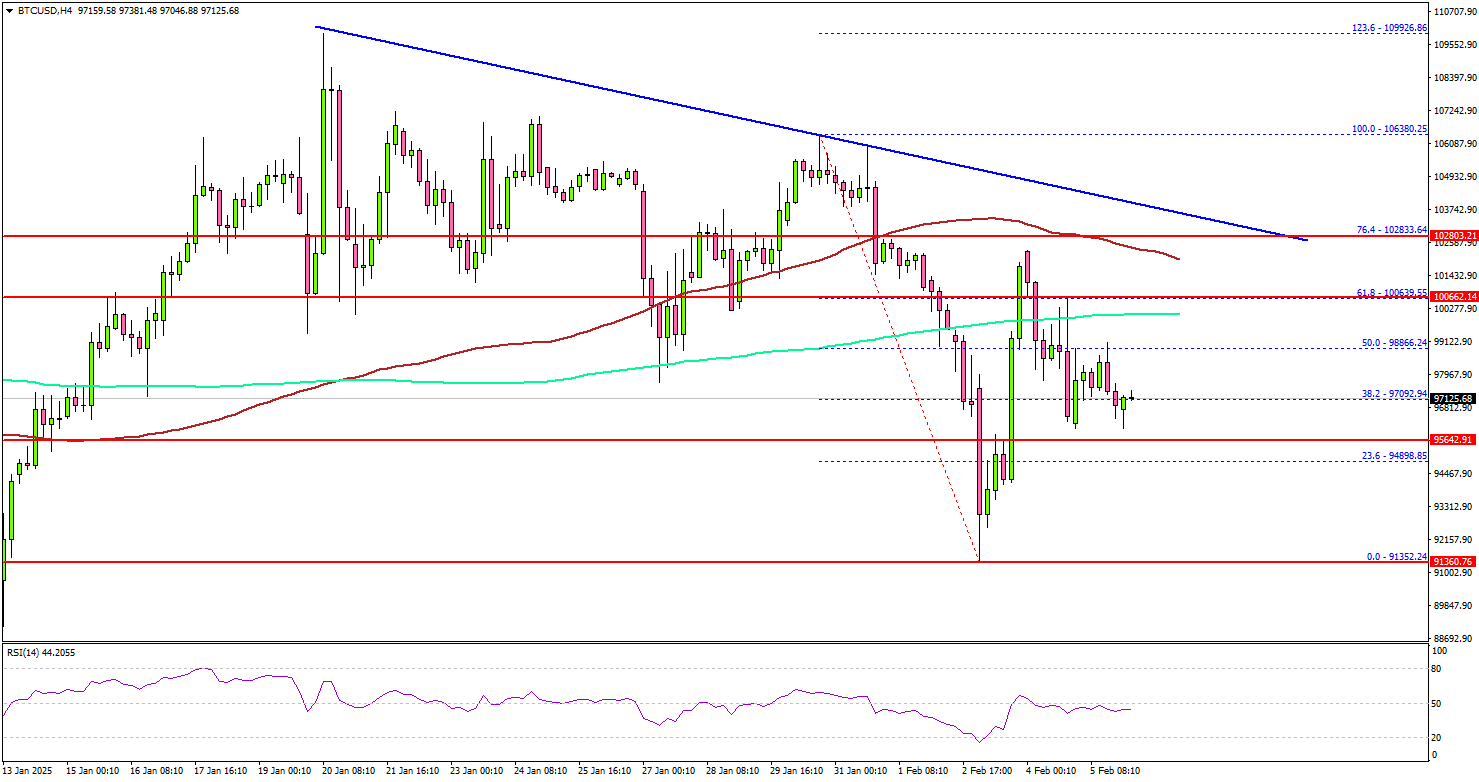
However, the bears remained active below the 100 simple moving average (red, 4-hour) and the 200 simple moving average (green, 4-hour).
On the upside, the price could face resistance near the $100,000 level. The next key resistance is $102,800 or the 76.4% Fib retracement level of the downward move from the $106,380 swing high to the $91,352 low.
There is also a key bearish trend line forming with resistance at $103,000 on the same chart. A successful close above $103,000 might start another steady increase. In the stated case, the price may perhaps rise toward the $105,000 level.
Immediate support is near the $96,500 level. The next key support sits at $95,000. A downside break below $95,000 might send Bitcoin toward the $93,200 support. Any more losses might send the price toward the $92,000 support zone.
Looking at Ethereum, there was a recovery wave above $2,650 but the bears remained active below the $3,000 resistance zone.
Today’s Economic Releases
- BoE Interest Rate Decision – Forecast 4.5%, versus 4.75% previous.
- US Initial Jobless Claims – Forecast 213K, versus 207K previous.