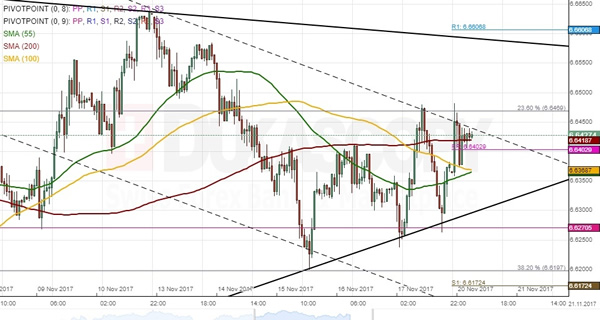
A symmetrical triangle has dominated the USD/CNH currency pair since early August. It seems that this pattern has reach maturity, thus pointing to a soon breakout. As apparent on the chart, the US Dollar has likewise formed a channel down. It is currently testing the upper boundary of this pattern. The given currency has just moved above the 55-, 100– and 200-hour SMA. This suggests that traders might still see a slight movement north. However, this advance should be limited by the upper triangle boundary and the weekly R1 in the 6.65/66 area. Given that the pair entered the senior pattern from above, the breakout is likely to be southwards. Thus, even if the rate manages to reach 6.65, the US Dollar is expected to depreciate against the Chinese Yuan in the medium term.