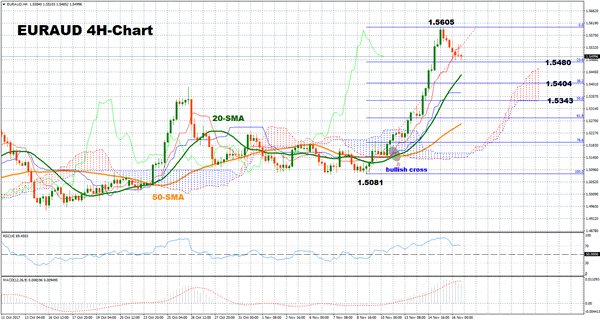
EURAUD has posted a strong rally over the week, flying from 1.5081 to a five-month high of 1.5605 (+3.50%) on early Wednesday. However, the pair paused its steep uptrend soon after as the market became overbought, retracing the 23.6% Fibonacci level of the aforementioned upleg at 1.5480.
The short-term bias in the four-hour chart remains bullish given that EURAUD is currently trading above the 20 and the 50-simple moving average lines which have been positively sloping after they recorded a bullish cross on November 10. Moreover, the fact that the pair is far above the Ichimoku cloud gives another positive signal to the market. Yet, according to the technical picture, risk is tilted to the downside as the RSI is still located in overbought area above 70 and the MACD has slowed down below its signal line (both indicators are marginally below their neutral zones in the one-hour chart).
Should the pair extend its losses, the pair might head down towards the 38.2% Fibonacci at 1.5404 after it successfully breaches the 23.6% Fibonacci at 1.5480. Then from here, a violation of the 50% Fibonacci at 1.5343 would turn the bias neutral from bullish and shift the focus to the bottom of the uptrend to 1.5081.
Alternatively, if market actions drive the pair up, an immediate resistance is likely to emerge at the five-month high of 1.5605 before the 1.5700 and 1.5800 psychological levels come into view.

