
Fundamental Analysis
This week, September 16-20, 2024, is key for the USD, with the Federal Reserve meeting in the spotlight, taking place between Tuesday, September 17, and Wednesday, September 18. Currently, according to the CME’s FedWatch tool, the probability of a 25-basis-point cut is 41%, while the chance of a more aggressive 50-basis-point cut stands at 59%, reflecting clear market expectations for a dovish move by the Fed. This follows mixed labour and inflation data from August, maintaining a moderate stance on how fast the Fed should ease.
Regarding market impact, futures of the major U.S. stock indices are trading at new all-time highs, with the S&P 500 climbing above 5600 points, trading around 5633.17 today. This reflects expectations of a dovish Fed pivot. A 25-basis-point cut would likely trigger more index buying, albeit with less intensity than a 50-point cut, which could ignite a significant short-term rally. The Nasdaq may also benefit notably, given its bias towards interest-rate-sensitive tech stocks.
For the USD, a 50-point cut would generate stronger bearish pressure, especially against pairs like EURUSD, currently trading at 1.1125, which we will analyze further below. GBPUSD may remain strong this week as the Bank of England is unlikely to ease its benchmark rate at its upcoming meeting on Thursday, September 19.
Technical Analysis
US Dollar Index (DXY)
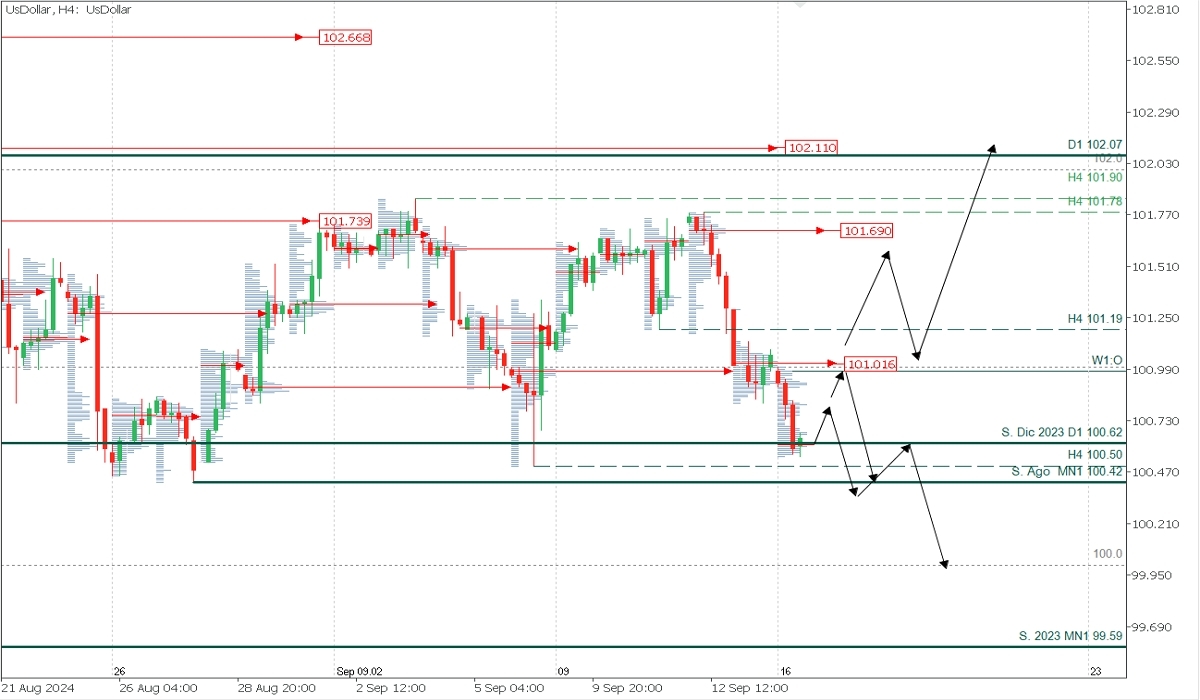
- Supply Zones (Sell): 101.016 and 101.69
- Demand Zones (Buy): 100.62 and 100.00
The USD is trading at August lows and within the consolidation range of the last two weeks. Monday’s bearish opening left a first concentration of volume around 100.62, a potential demand zone expected to trigger buying toward the nearest supply zone around 101.01. Bearish defences in this area may renew the downward bias, targeting a break of the August support at 100.42, continuing the sell-off towards the round number 100.00, or extending to the 2023 support at 99.59. However, a decisive breakout above the first supply zone around 101.01 could activate a broader correction toward 101.19 or last week’s supply zone between 101.50 and 101.70, where sellers would likely defend the 101.00 level.
EURUSD
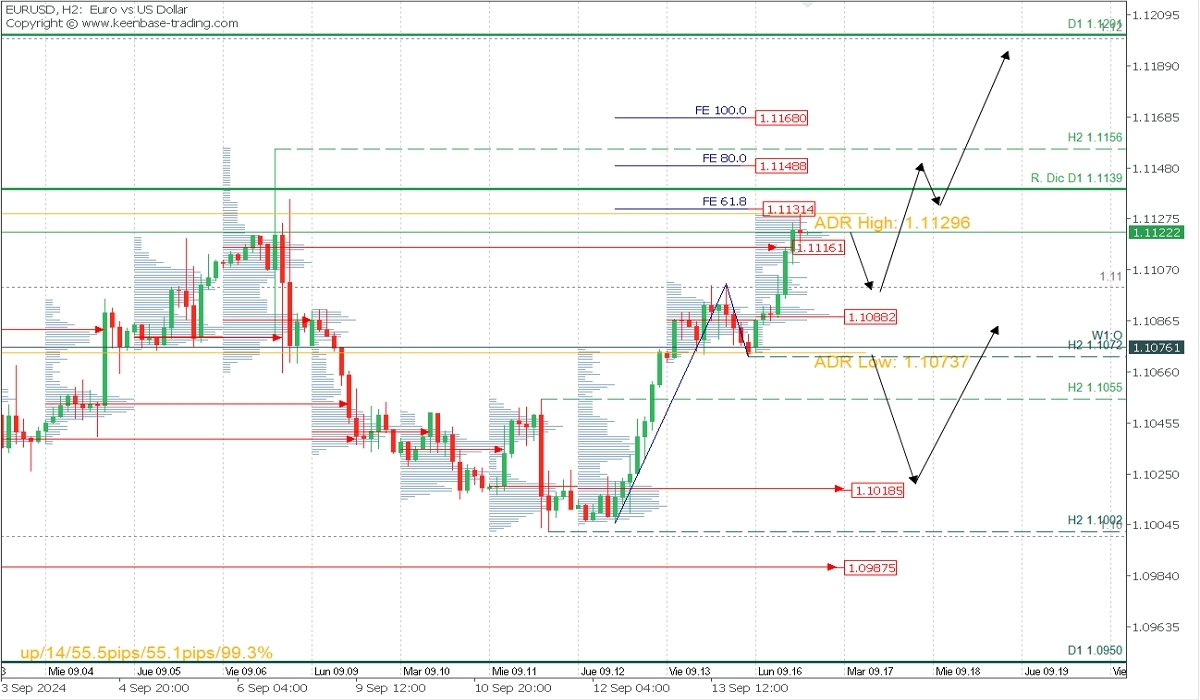
- Supply Zones (Sell): 1.1150, 1.1166, and 1.1185
- Demand Zones (Buy): 1.1088 and 1.1018
The bullish opening reached and surpassed the supply zone around 1.1116, stopping at the current average bullish range at 1.1129. A pullback is expected toward 1.11 or the POC of the first sessions at 1.1088, from where a new rebound is anticipated, as bulls defend this level with potential targets in the next supply zones at 1.1150 and 1.1166, close to the 80% and 100% Fibonacci extensions, which, once reached, validate 1.1072 as the last relevant support. Currently, the last validated support of the ongoing bullish movement is at 1.1002.
Technical Summary:
- Bearish corrective scenario: Sell below 1.111 with TP at 1.11 and 1.1090 on extension.
- Bullish continuation after pullback: Buy above 1.1088 with TP at 1.1150, 1.1168, or 1.12 on extension for the week.
GBPUSD
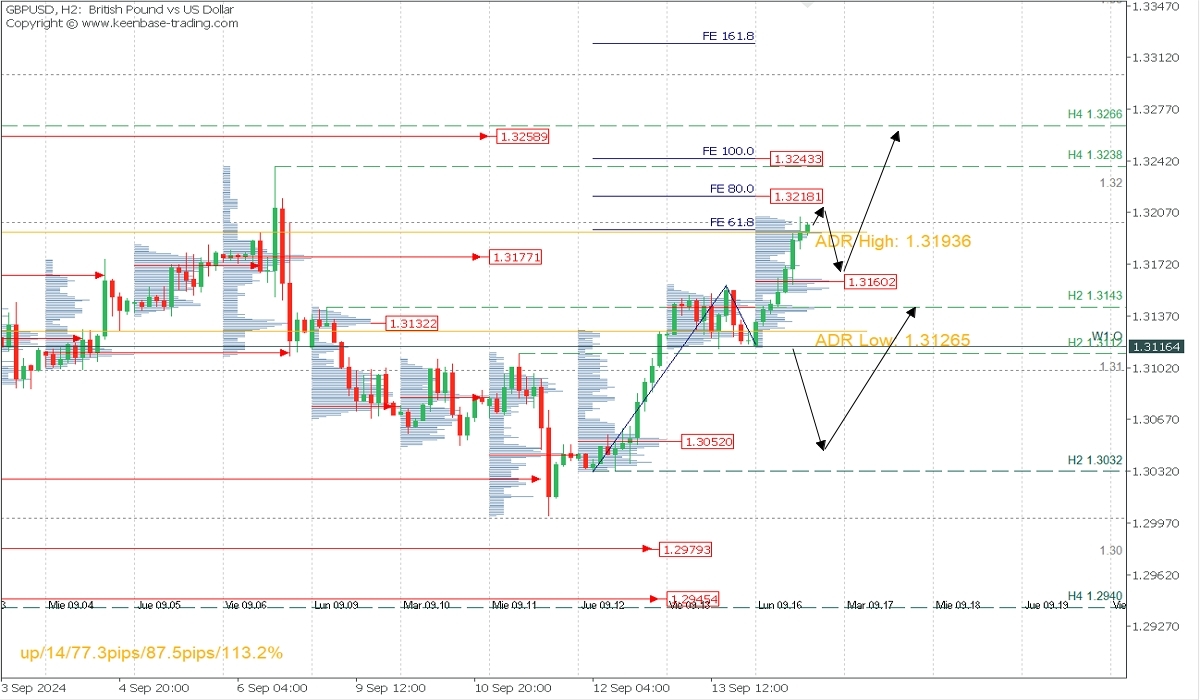
- Supply Zones (Sell): 1.32, 1.3259
- Demand Zones (Buy): 1.3160 and 1.3052
The bullish opening reflects greater strength from the bulls after decisively breaking through the supply zone around 1.3177. A pullback below 1.3218 is expected with intraday targets at 1.3160, the last demand zone from the first sessions of the day. Weekly bullish continuation could extend to the next demand zones at 1.3258 and round number 1.33. This scenario validates 1.3116 as the last relevant support in the new intraday bullish trend.
Technical Summary:
- Bearish corrective scenario: Sell below 1.3218 with a target of 1.3160.
- Bullish continuation scenario: Buy above 1.3160 with targets at 1.3260 and 1.33 on extension.
*POC definition: POC = Point of Control: The level or zone where the highest volume concentration occurred. If this level was followed by a bearish movement, it is considered a sell zone and forms resistance. Conversely, if it followed a bullish impulse, it is considered a buy zone, usually located near lows, forming support areas.*