
- Recent lacklustre key US economic growth-related data; ISM Manufacturing PMI & ADP Employment Change reinforced the recent bout of JPY strength.
- Bearish elements in the JPY crosses Index suggest further potential JPY strength in the medium-term horizon.
- Watch the 140.25 support on the USD/JPY.
A déjà vu experience is now ripping across the foreign exchange market where it saw a swift bout strengthening in the Japanese yen during a recent period from 31 July to 5 August, primarily triggered by the Bank of Japan’s interest rate hike.
Since Tuesday, 3 September, the Japanese yen bulls have reared their horns again as the JPY rallied by 3.5% against the US dollar at this time of the writing.
JPY has strengthened across the board
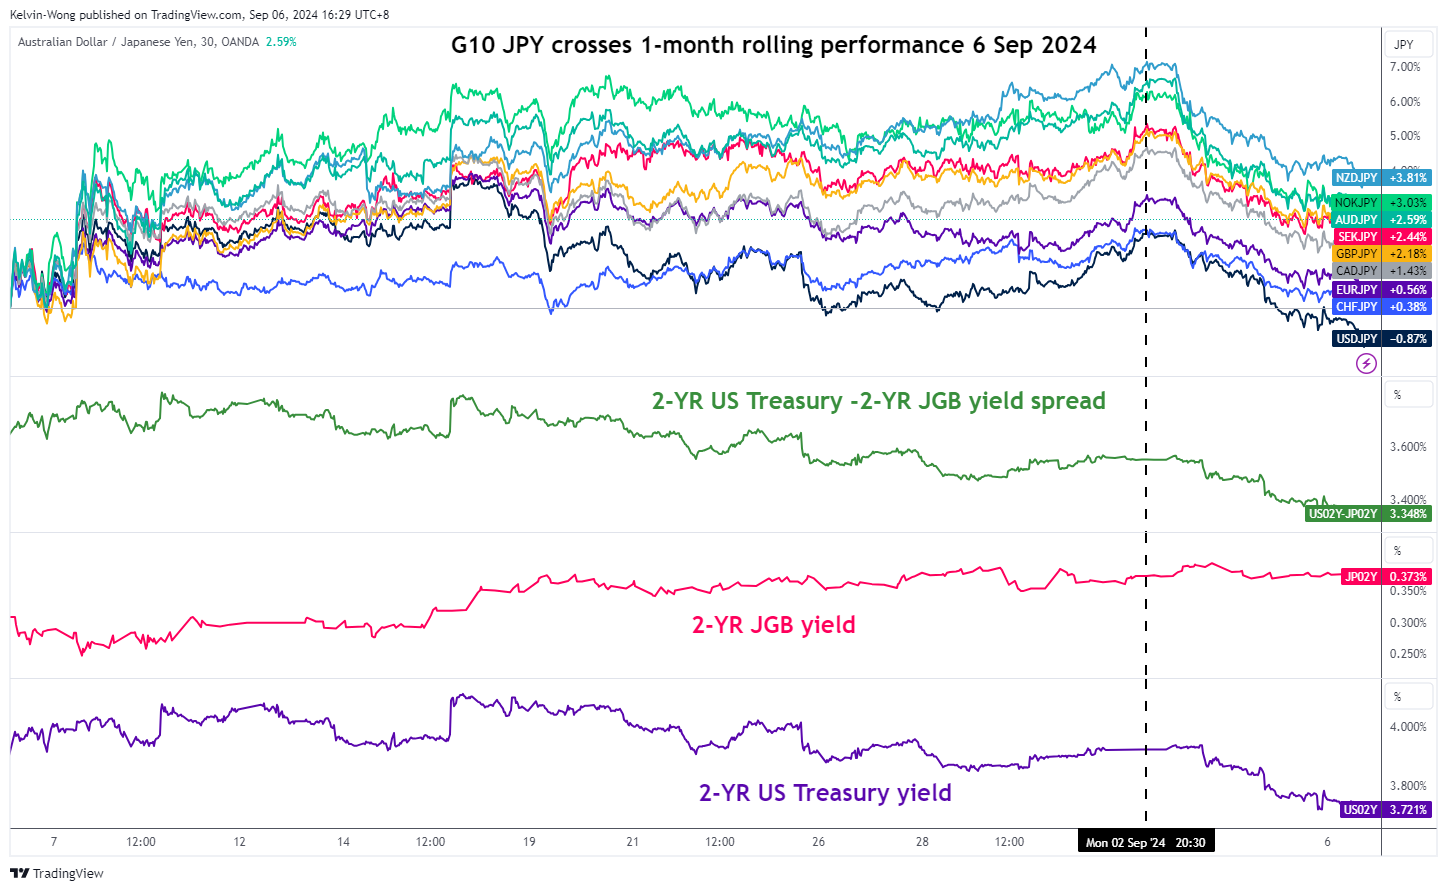
Fig 1: 1-month rolling performances of G-10 JPY crosses as of 6 Sep 2024 (Source: TradingView, click to enlarge chart)
Based on a one-month rolling performance basis, the G-10 JPY cross pairs (JPY is being quoted as the variable currency) have started to inch downward since Monday, 2 September where the worst performers are; USD/JPY (-1.13%), CHF/JPY (+0.12%), and EUR/JPY (+0.39%).
The recent strength seen in the Japanese yen in the past week is not attributed to the Bank of Japan but triggered by an increasing risk that the US economy may have already slipped into a recession and the US Federal Reserve being late on enacting an interest cut cycle may be forced to introduce bigger cuts on its Fed funds rate down the road.
The 2-year US Treasury yield has a higher sensitivity toward the US Fed’s monetary policy stance, slipped by 39 basis points from 4.10% printed on 16 August to 3.71% at this time of the writing while the 2-year JGB yield inched higher from 0.32% to 0.37% over the same period (see Fig 1).
Overall, the US Treasury yield premium against JGB has narrowed, reinforced by weak private sector hiring data in the US; the ADP employment change for August added the lowest number of jobs in August at 99K, over a downwardly revised 111K in July, and well below forecasts of 145K.
Today’s release of the government-compiled non-farm payroll data for August will shed more light on the state of the US labour market (Fed Chair Powell has highlighted labour market condition is now a primary focus of the Fed in his Jackson Hole Symposium speech); especially the unemployment rate that rose to 4.3% in July, the highest level since October 2021.
JPY crosses index has flashed out major bearish conditions
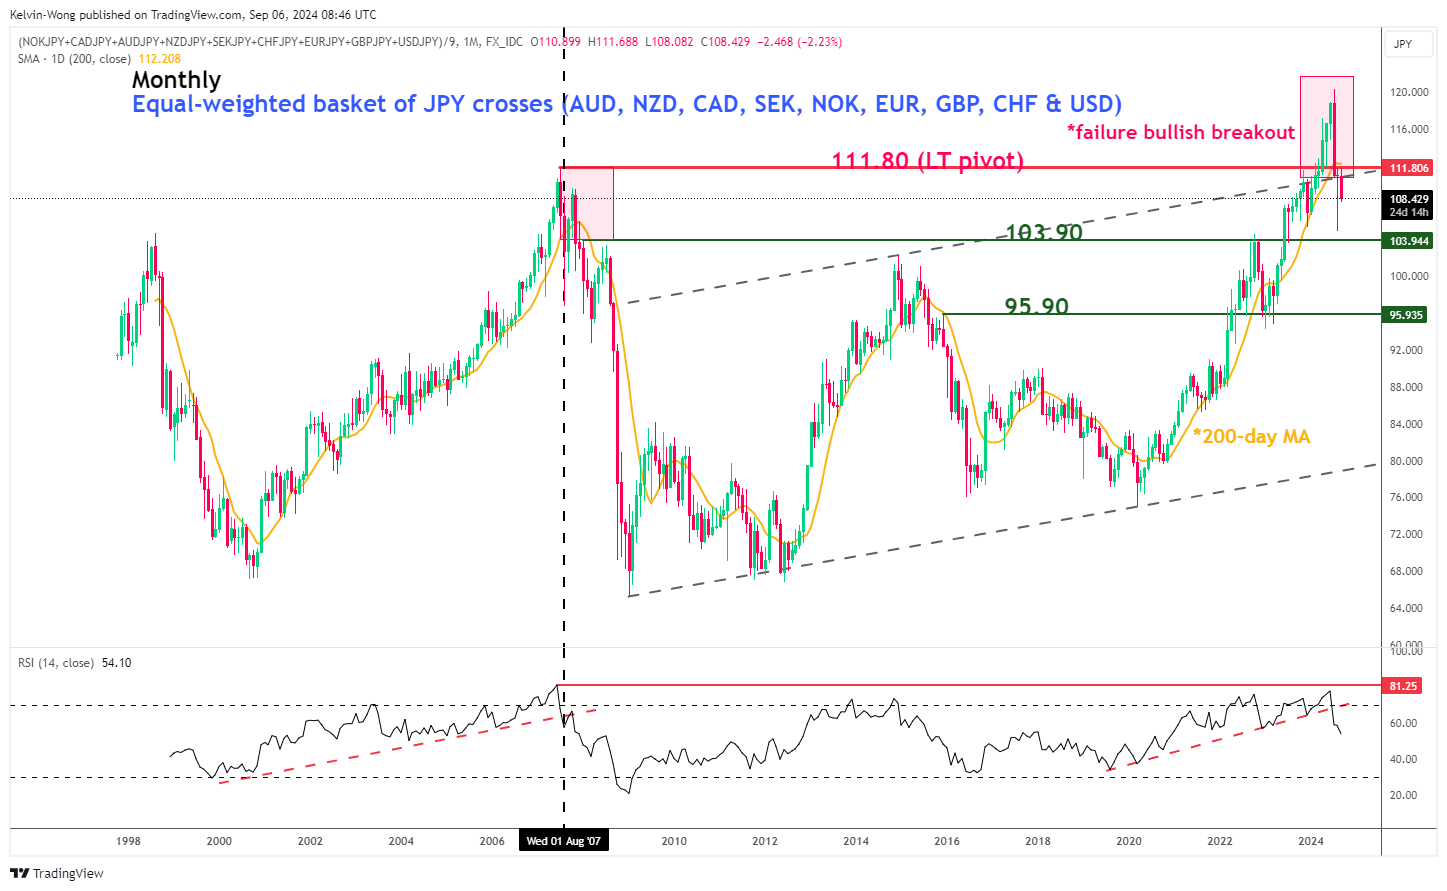
Fig 2: JPY crosses Index long-term secular trend as of 6 Sep 2024 (Source: TradingView, click to enlarge chart)
The JPY crosses Index, created by using an equal-weighted basket of G-10 JPY crosses is showing signs of technical weakness (see Fig 2).
Its monthly chart has depicted a recent major failure bullish breakout scenario from Feb to July as the JPY crosses Index reintegrated below 111.80, a major swing high formed in July 2007, a few months before the global financial crisis was unleashed.
Its monthly RSI momentum indicator triggered a bearish condition in July where it broke below a key ascending trendline support. Interestingly, a similar RSI bearish condition occurred in the past on August 2007 before the JPY crosses Index staged a significant decline of 36% in the next seven months.
If the 111.80 key long-term pivotal resistance of the JPY crosses Index is not surpassed to the upside, it faces the risk of a further decline toward the 103.90 major support in the first step; another bout of potential JPY strength looming on the horizon.
USD/JPY is eyeing the 140.25 support next
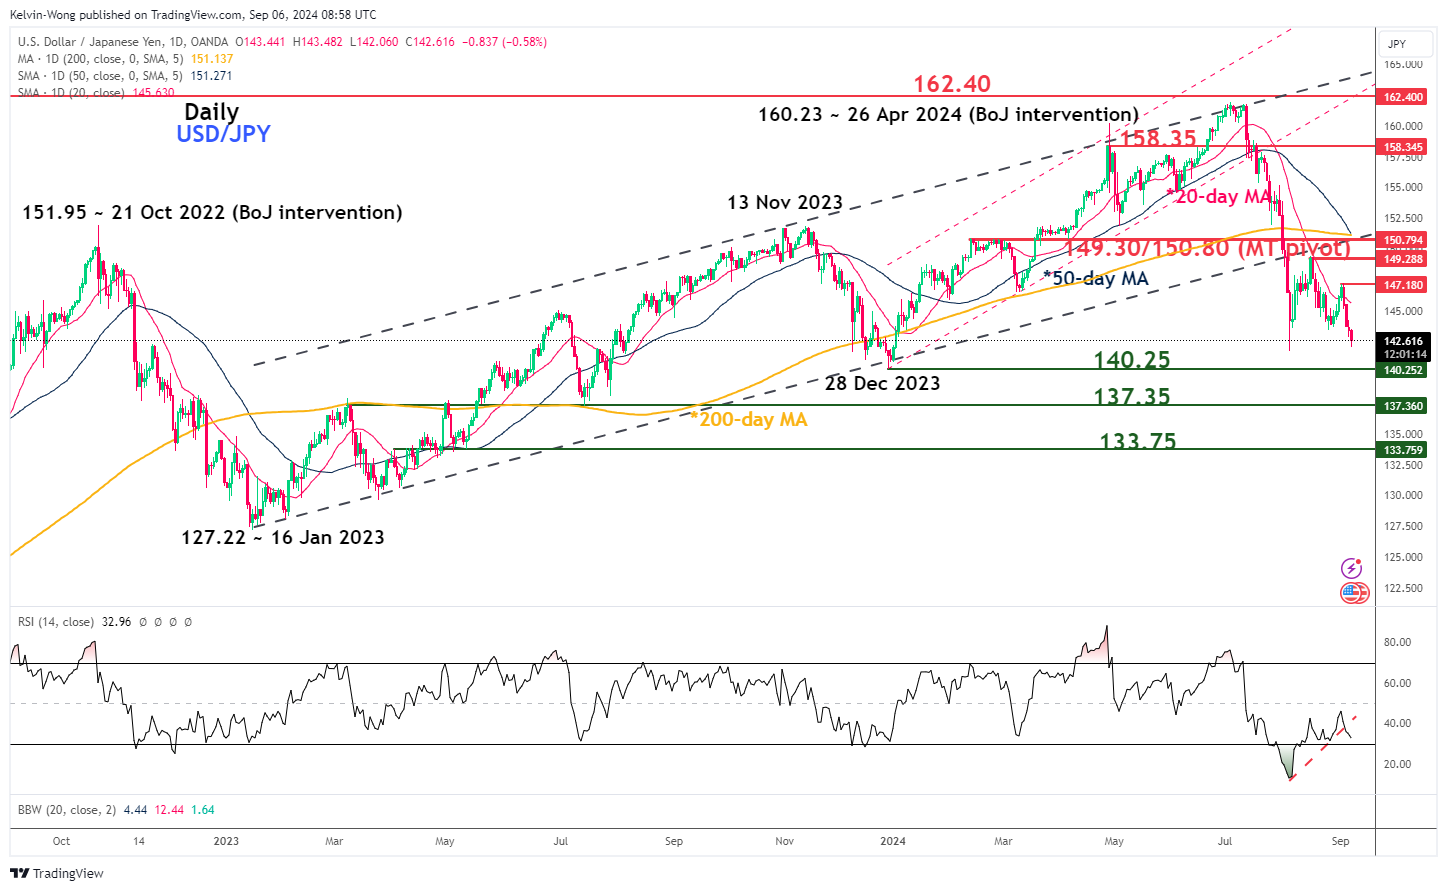
Fig 3: USD/JPY medium-term & major trends as of 6 Sep 2024 (Source: TradingView, click to enlarge chart)
The recent major uptrend phase of the USD/JPY from 16 January 2023 has been damaged and technical analysis is suggesting that it is now evolving into a potential medium-term corrective decline sequence (see Fig 3).
The daily RSI momentum indicator is still exhibiting bearish elements which suggests that the ongoing multi-month corrective decline phase in place since 3 July 2024 may have not reached an exhaustion stage yet.
A break below 140.25 support exposes the next medium-term supports at 137.35 and 133.75.
Only a clearance above the 149.30/150.80 key medium-term pivotal resistance invalidates the bearish scenario for the next medium-term resistance to come in at 158.35 in the first step.