
- Major US bench stock indices (S&P 500, Nasdaq 100, Dow Jones Industrial Average & Russell 2000) started the month of September on a weak footing.
- The Nasdaq 100 was the worst performer (-3.15%) on Tuesday, 3 September dragged down by the higher-beta technology sector (Nvidia & other semiconductor stocks)
- Recent weak performance of Nvidia (ex-post Q2 earnings) may trigger a negative liquidity cascading effect, in turn, a potential jump in the VIX.
- Watch the 19,670 key medium-term pivotal resistance on the Nasdaq 100.
Since our last publication, the price actions of the Nasdaq 100 have staged a bounce of 4.9% to hit the 19,900 handle on 22 August. However, it could not maintain its short-term bullish momentum, stage a reversal, and give up all its prior gains ex-post Q2 Nvidia’s earnings results on 29 August.
Thereafter, the Nasdaq 100 rebounded by 2.8% from its Thursday, 29 August low but failed to have a clearance above its 50-day moving average that acted as an intermediate resistance at around 19,670.
Labour Day “massacre” reinforced by weak ISM Manufacturing PMI
All the major US stock indices started the month of September on a weak footing after the Labour Day holiday. The Nasdaq 10 was the worst performer among the benchmark stock indices, shedding -3.15% on Tuesday, 3 September, dragged down by a horrendous loss of 9.5% inflicted on Nvidia, the third largest market cap component stock in Nasdaq 100
Yesterday’s cascading negative feedback loop in the US stock indices has been reinforced by a weak print of 47.2 in the ISM Manufacturing PMI data that slightly missed expectations of 47.5 where manufacturing activities in the US contracted for the fifth consecutive month.
Hence, the hard-landing playbook narrative is back at the forefront as the market participants are “fearful” that the US Federal Reserve has been late in enacting the interest rate cut cycle in the US, in turn, the higher beta (mega-cap technology and semiconductor stocks) were the worst performers as these groups of stocks have been leading in the US stock market since the start of 2024.
Nvidia is like an “elevator”
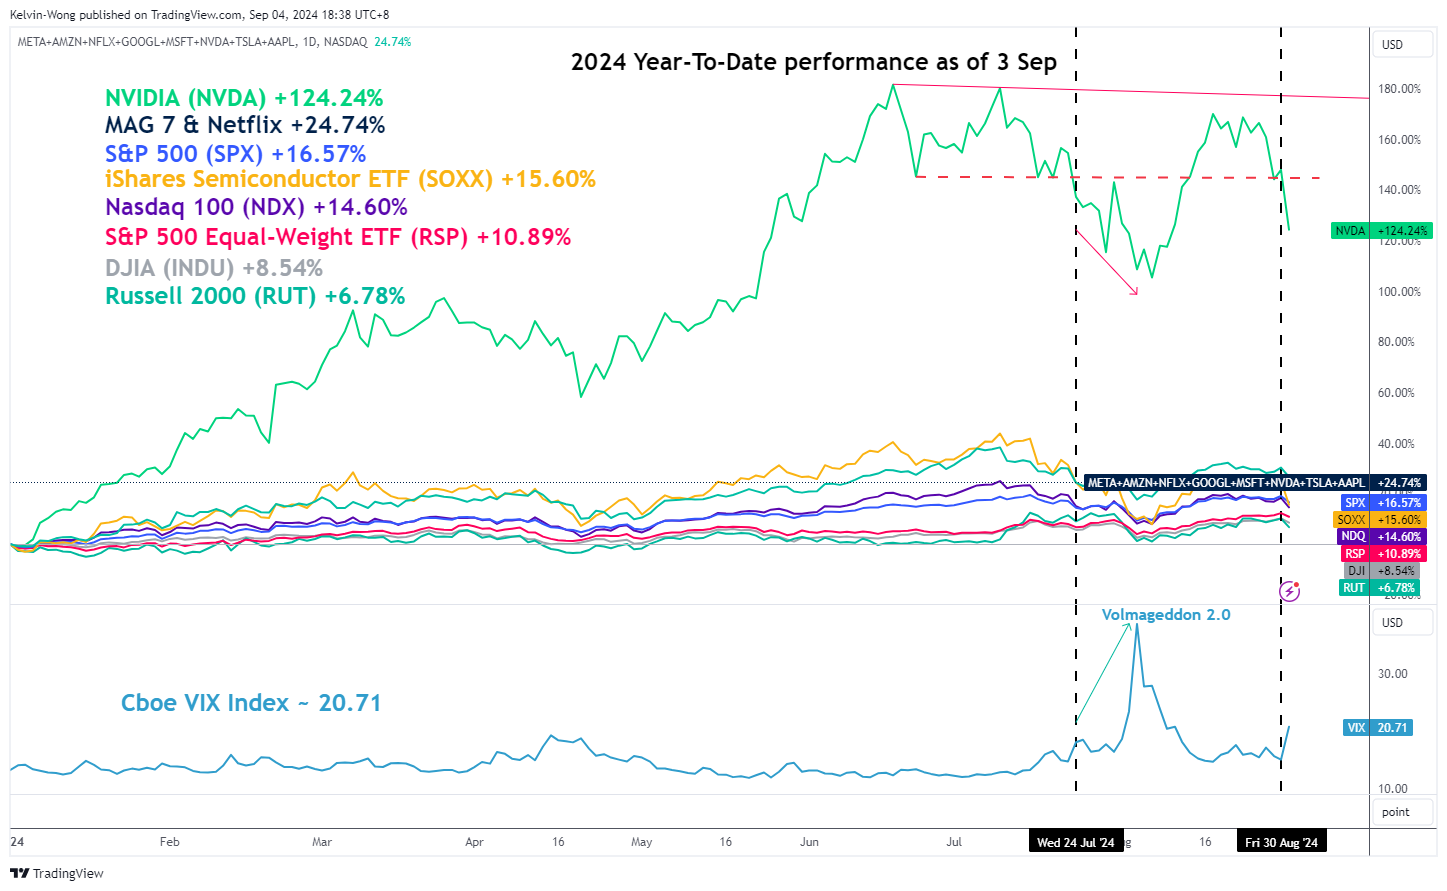
Fig 1: 2024 YTD performance of Nivida & major US stock indices with VIX as of 3 Sep 2024 (Source: TradingView, click to enlarge chart)
The share price of Nvidia has staged a magnificent rally from late April to June this year and it hit a current year-to-date peak market capitalization of US$3.33 trillion on 18 June, overtook Microsoft and Apple, and became the world’s most valuable company at that juncture.
This remarkable feat by Nvidia has created a positive liquidity-cascading impact on the S&P 500 and Nasdaq 100 as active equities-based fund managers (inclusive of smart beta factors and tactical exchange-traded funds) are likely to allocate a significant portion of their funds to Nvidia.
This type of positive liquidity-cascading effect also dampened the implied volatility of the US stock market as measured by the VIX which hovered at low levels of around 12 to 14 from late April to early July. Therefore, these low levels of VIX induced more risk-taking behaviour (skewed towards equities in this context) (see Fig 1).
Interestingly, the prior decline in the share price of Nvidia (before its Q2 earnings results release) from 10 July to 24 July led to a minor jump in the VIX from 12.84 to 18.02 that preceded Volmageddon 2.0 on 5 November, triggered a synchronised risk-off behaviour in the major US stock indices which in turn induces a negative liquidity-cascading effect, amplified by systematic funds that use implied volatility as a control risk measure that required to trim risk assets significantly such as equities in their portfolios.
A cautionary note is that the recent decline of Nvidia (ex-post earnings) from 29 August to 3 September has similar negative liquidity-cascading effect traits.
Nasdaq 100 at risk of revisiting 17,160/16,930
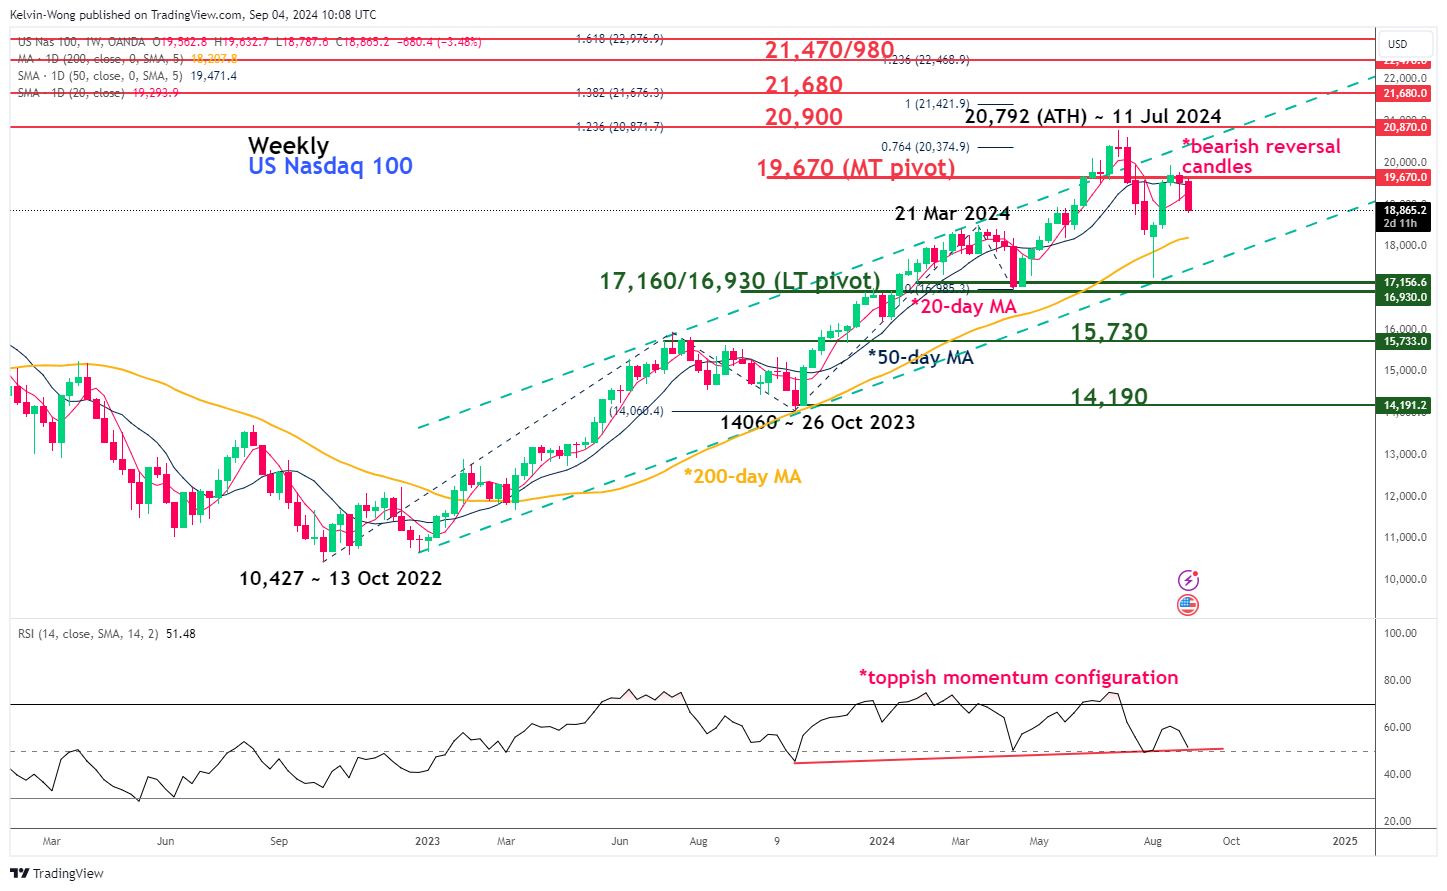
Fig 2: Nasdaq 100 CFD major & medium-term trends as of 4 Sep 2024 (Source: TradingView, click to enlarge chart)
In the lens of technical analysis, the current price actions seen in the Nasdaq 100 CFD (a proxy of Nasdaq 100 E-mini futures) have shaped a series of weekly bearish reversal candlesticks in the past two weeks after a test on the 19,670 key medium-term pivotal resistance (also close to the 50-day moving average).
For the week of 19 August and 26 August, it has formed a “Shooting Star” and Hanging Man” bearish reversal candlestick respectively, and the current date-to-week price action at this time of the writing has triggered a negative follow-through bearish Marubozu candlestick as it pierced below its 20-day moving average (see Fig 2).
These observations suggest a rapid change in sentiment from bullish to bearish that may unleash further weakness on the Nasdaq 100 CFD towards the 17,160/16,930 long-term pivotal support (close to the 5 August swing low).
Only a clearance above 19,670 invalidates the bearish bias for a continuation of its impulsive upmove sequence for the next major resistances to come in at 20,900 and 21,680 in the first step.