
- Gold prices surpassed the $2500/oz level on Friday despite a decrease in the likelihood of a 50 bps cut at the Federal Reserve’s September meeting.
- The rally in gold prices is attributed to dovish remarks by Federal Reserve policymakers and concerns over rising tensions in the Middle East.
- From a technical standpoint, the weekly chart indicates a strong bullish trend for gold, but a retracement towards the 2450 mark is possible.
Gold prices are aiming to consolidate above the $2500/oz level after surpassing this psychological threshold on Friday. This movement took some market participants by surprise, especially considering the initial reaction of the precious metal to the US CPI data earlier in the week.
Despite the reduction in the likelihood of a 50 bps cut at the Federal Reserve’s September meeting—dropping from 50% to 28.5%—gold managed to breach the $2500/oz mark. This reduction in the expected rate cut theoretically should have exerted downward pressure on gold prices.
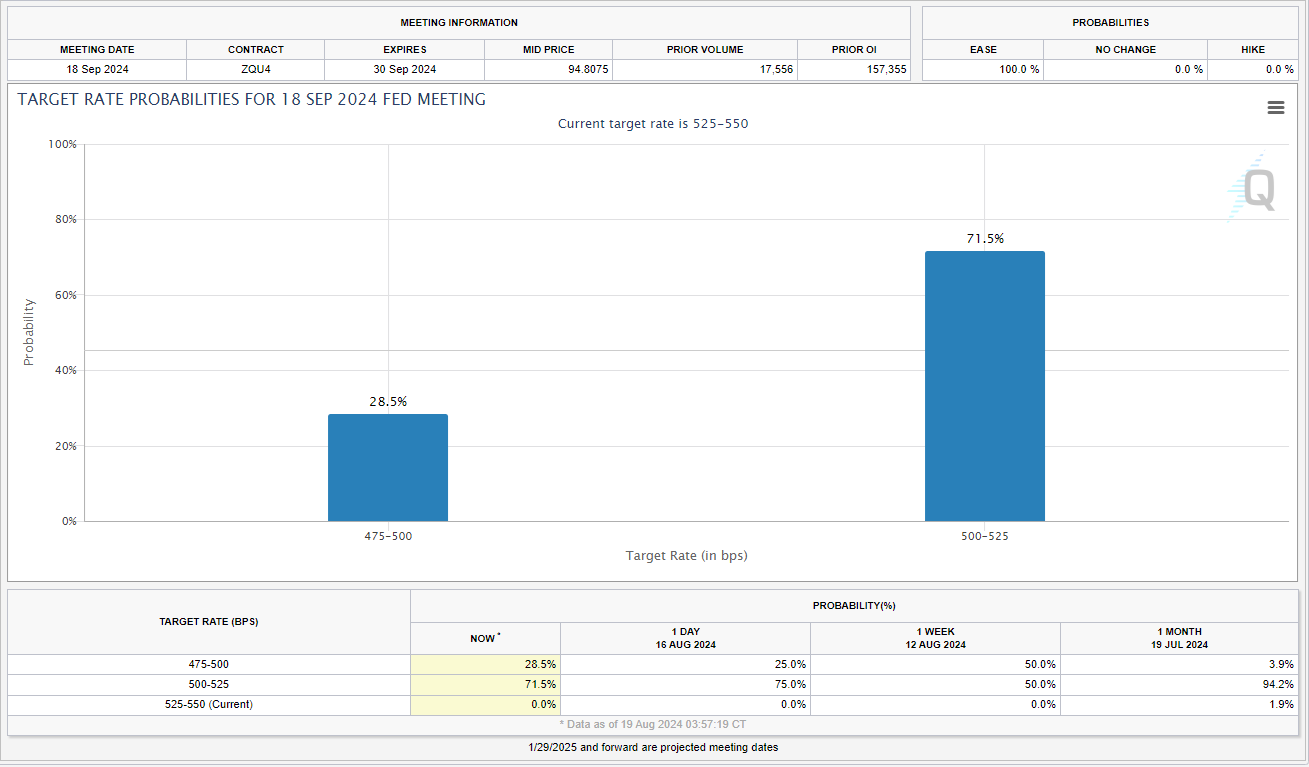
Source: CME FedWatch Tool
Examining the reasons behind the recent rally in gold prices, it primarily stems from dovish remarks made by Federal Reserve policymakers. Chicago Fed President Austin Goolsbee expressed caution about maintaining the restrictive policy for longer than necessary. These comments, along with ongoing concerns regarding a ceasefire deal in the Middle East, are likely driving factors behind the surge in gold prices.
Markets are also uneasy about rising tensions in the Middle East and the potential for an attack on Israel by Iran. Such an event could lead to increased demand for safe-haven assets and might materialize if a ceasefire agreement over Gaza is not achieved.
Technical Analysis Gold (XAU/USD)
From a technical standpoint, the weekly chart shows that the bullish trend remains strong. However, a retracement towards the 2450 mark is possible and would not negate the bullish outlook, given that the prior swing low is around 2350 on the weekly chart.
Therefore, the current range is substantial, and even a significant pullback might not deter bulls from re-entering long positions if the price corrects sufficiently.
GOLD (XAU/USD) Weekly Chart, August 19, 2024
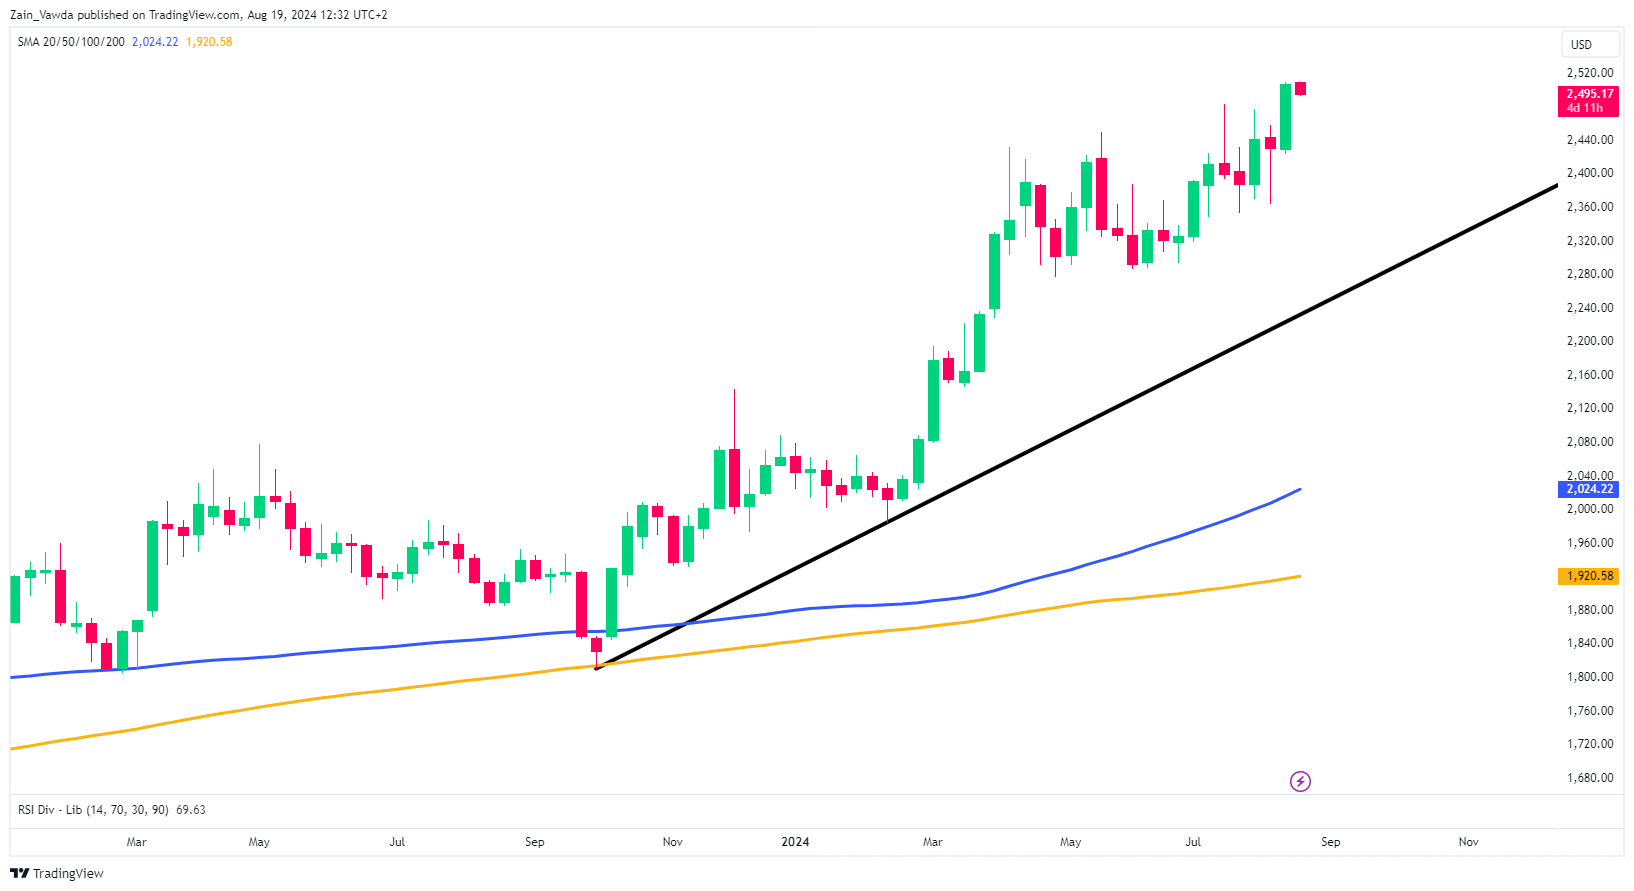
Source: TradingView (click to enlarge)
Gold formed a morning star candlestick pattern after the daily close on Friday. However, since this pattern emerged following a brief retracement within what might still be considered the peak of an uptrend, its reliability is questionable.
Additionally, the possibility of profit-taking after Friday’s substantial rally suggests that further upward movement could be restricted today, with an increasing chance of a price pullback towards the $2472-2480 range.
GOLD (XAU/USD) Daily Chart, August 19, 2024
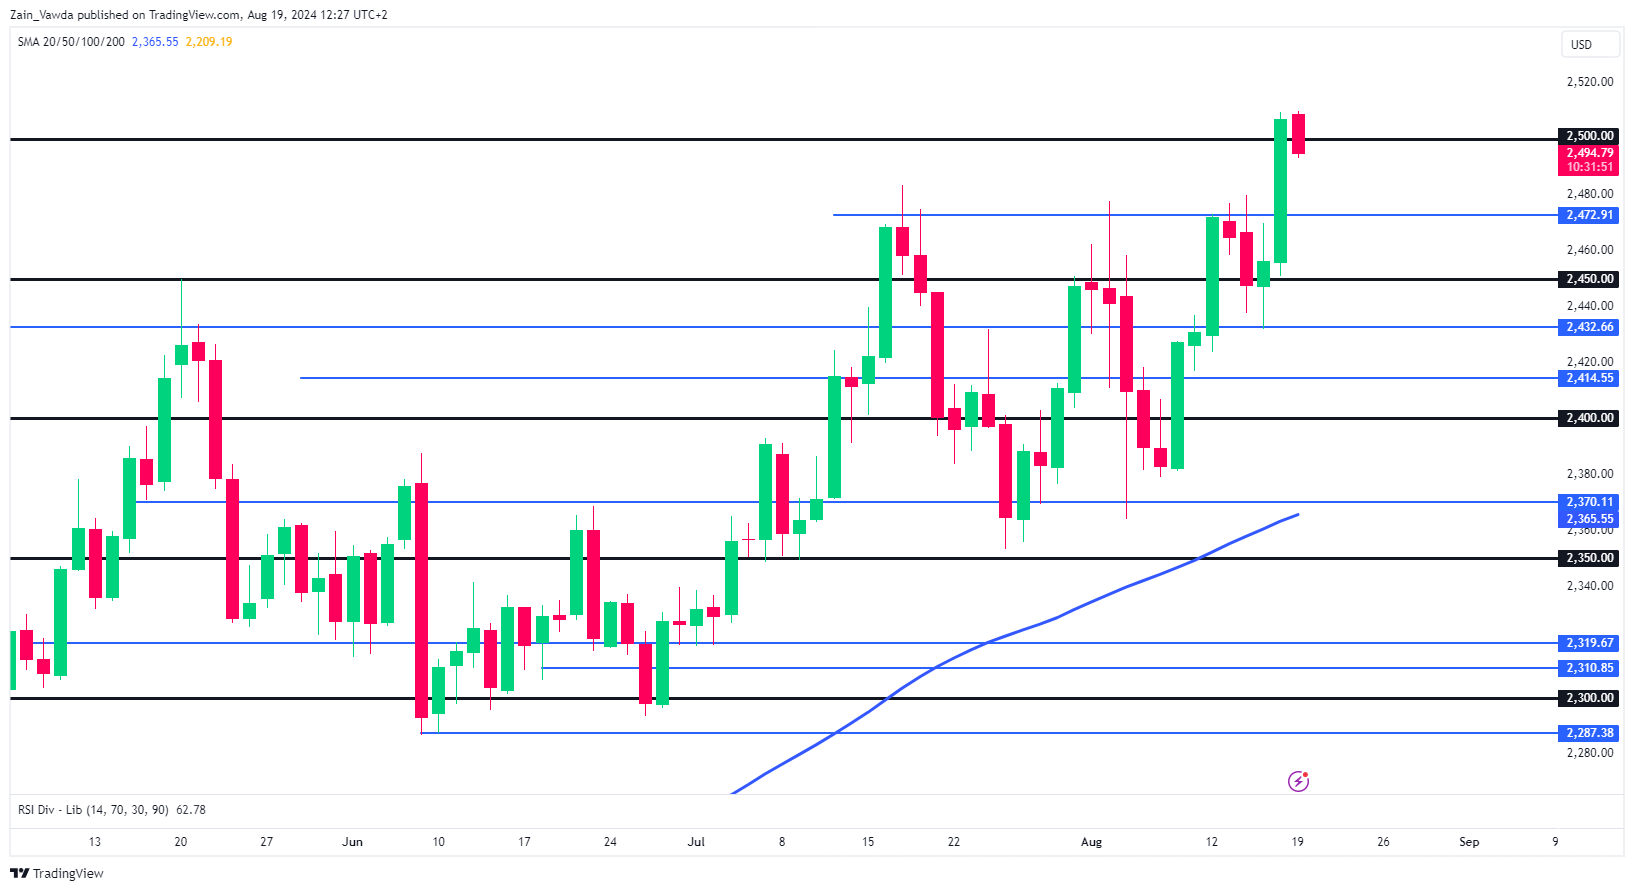
Source: TradingView (click to enlarge)
Support
- 2472
- 2450
- 2432
Resistance
- 2500
- 2509
- 2525