
 struggles aided gold’s recovery in the latter part of the US session, a trend that has persisted into the London open.)
- Gold prices rebounded after a post-CPI selloff, aided by a struggling US Dollar Index.
- A sustained move above $2500/oz for gold may require an additional catalyst, like geopolitical risks.
- The DXY faces challenges and is likely to remain subdued, with technical indicators suggesting a potential retracement. Will it Materialize?
Gold prices rebounded after a post-CPI selloff that pushed the precious metal down to around $2438/oz. The US Dollar Index (DXY) struggles aided gold’s recovery in the latter part of the US session, a trend that has persisted into the London open.
Yesterday’s selloff was somewhat unexpected, given that US CPI figures were below expectations. Market participants reduced their rate cut expectations, which may have contributed to the dip in gold prices.
It’s likely that a portion of the anticipated interest rate cuts has already been factored in by the market. However, the extent of this pricing remains uncertain, and market participants are expected to stay cautious as gold approaches the $2500/oz mark.
While rate cuts generally benefit the non-yielding precious metal, a sustained move above the $2500/oz level may require an additional catalyst, such as geopolitical risks. Even then, the move might not be sustainable.
US Dollar Index (DXY)
The US Dollar Index (DXY) remains muted in early trading, persistently hovering below the 102.64 resistance level. Market participants appear satisfied with current inflation figures, shifting the focus to whether the Federal Reserve will implement a 25 or 50 basis point cut in September.
The DXY is grappling to recover some of its recent losses, and this struggle seems likely to persist. Technically, the DXY shows potential for a retracement, but the dominating influence of fundamental factors may limit any significant recovery.
US Dollar Index Daily Chat, August 15, 2024
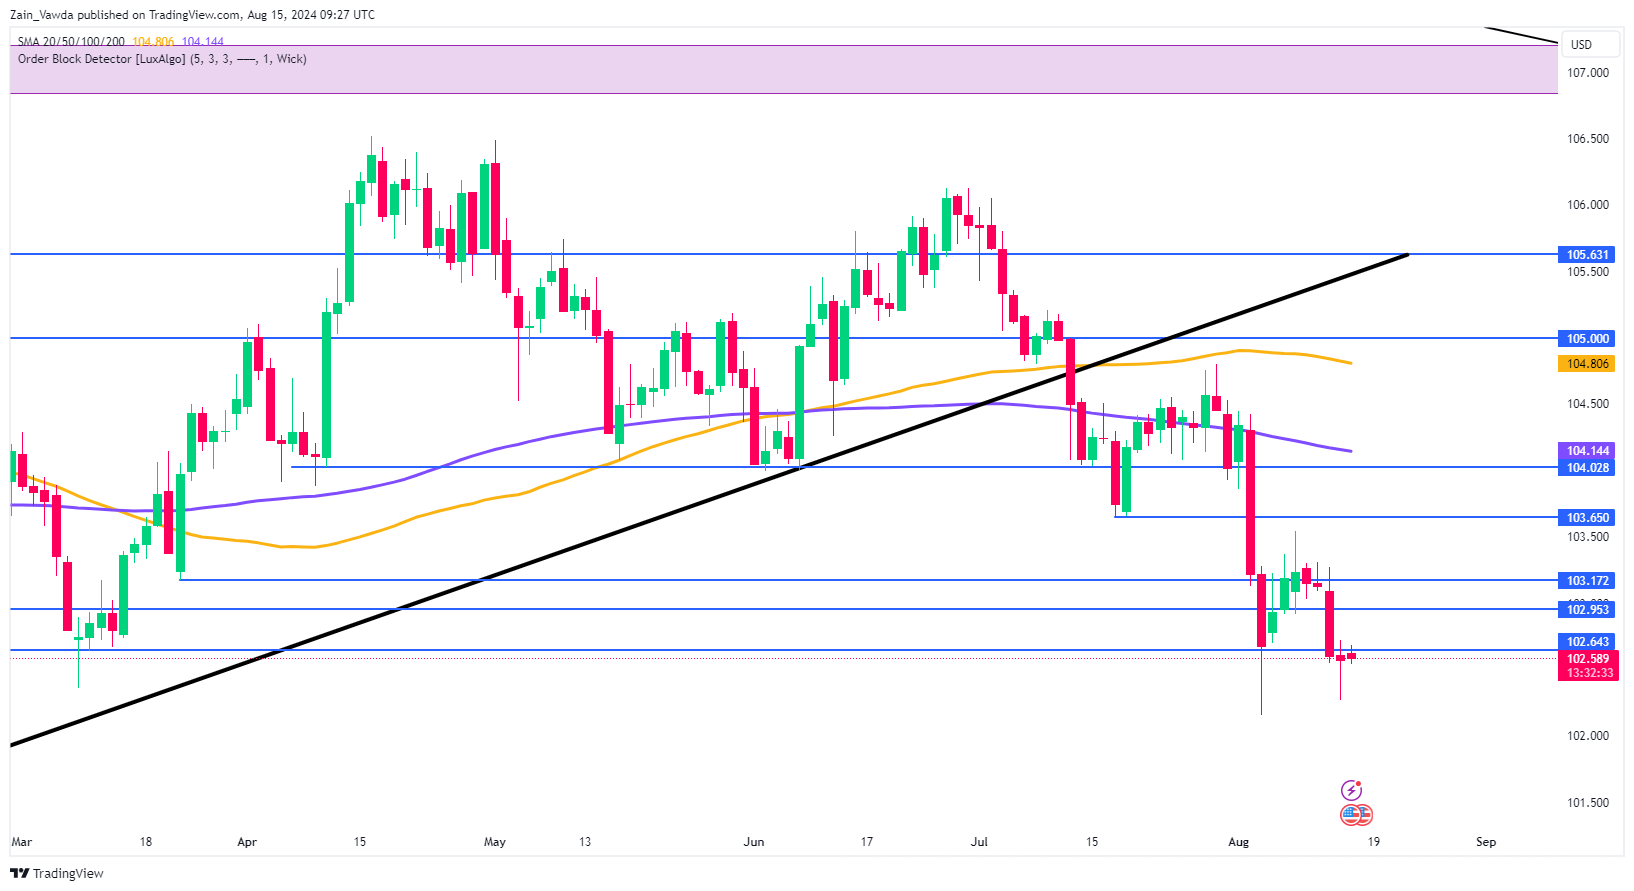
Source:TradingView.com
Support
- 102.40
- 101.20
- 100.26 (200-day MA)
Resistance
- 103.00
- 103.65
- 104.00
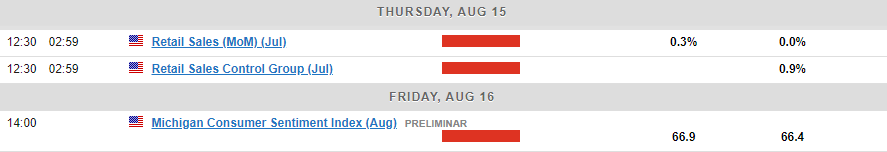
Economic Data Ahead
Several significant data releases this week could affect the US Dollar, and consequently, gold prices. Today, we expect the US industrial production data, followed by tomorrow’s US housing starts and the preliminary University of Michigan Sentiment data.
Additionally, some Federal Reserve policymakers are scheduled to speak, although these events are unlikely to cause any substantial shifts in the US Dollar regardless of the outcomes.
Technical Analysis Gold (XAU/USD)
From a technical perspective, gold aims to recover from consecutive losing days. Despite closing in the red yesterday, the precious metal reached a fresh high of 2480.00 before the selloff commenced.
Examining the daily chart, we observe a pattern of higher lows and higher highs, although breaking above 2480 has been challenging. The price range of 2350 to 2500, established since early July, is likely to persist until the Federal Reserve’s September meeting.
On an intraday basis, key resistance levels are at 2472 and 2480, while crucial support levels to watch are at 2450 and yesterday’s low of 2438. Keep in mind that with upcoming US data, any move above the 2480 level is unlikely to be sustained, as buying pressure for the precious metal remains strong.
GOLD (XAU/USD) Daily Chart, August 15, 2024
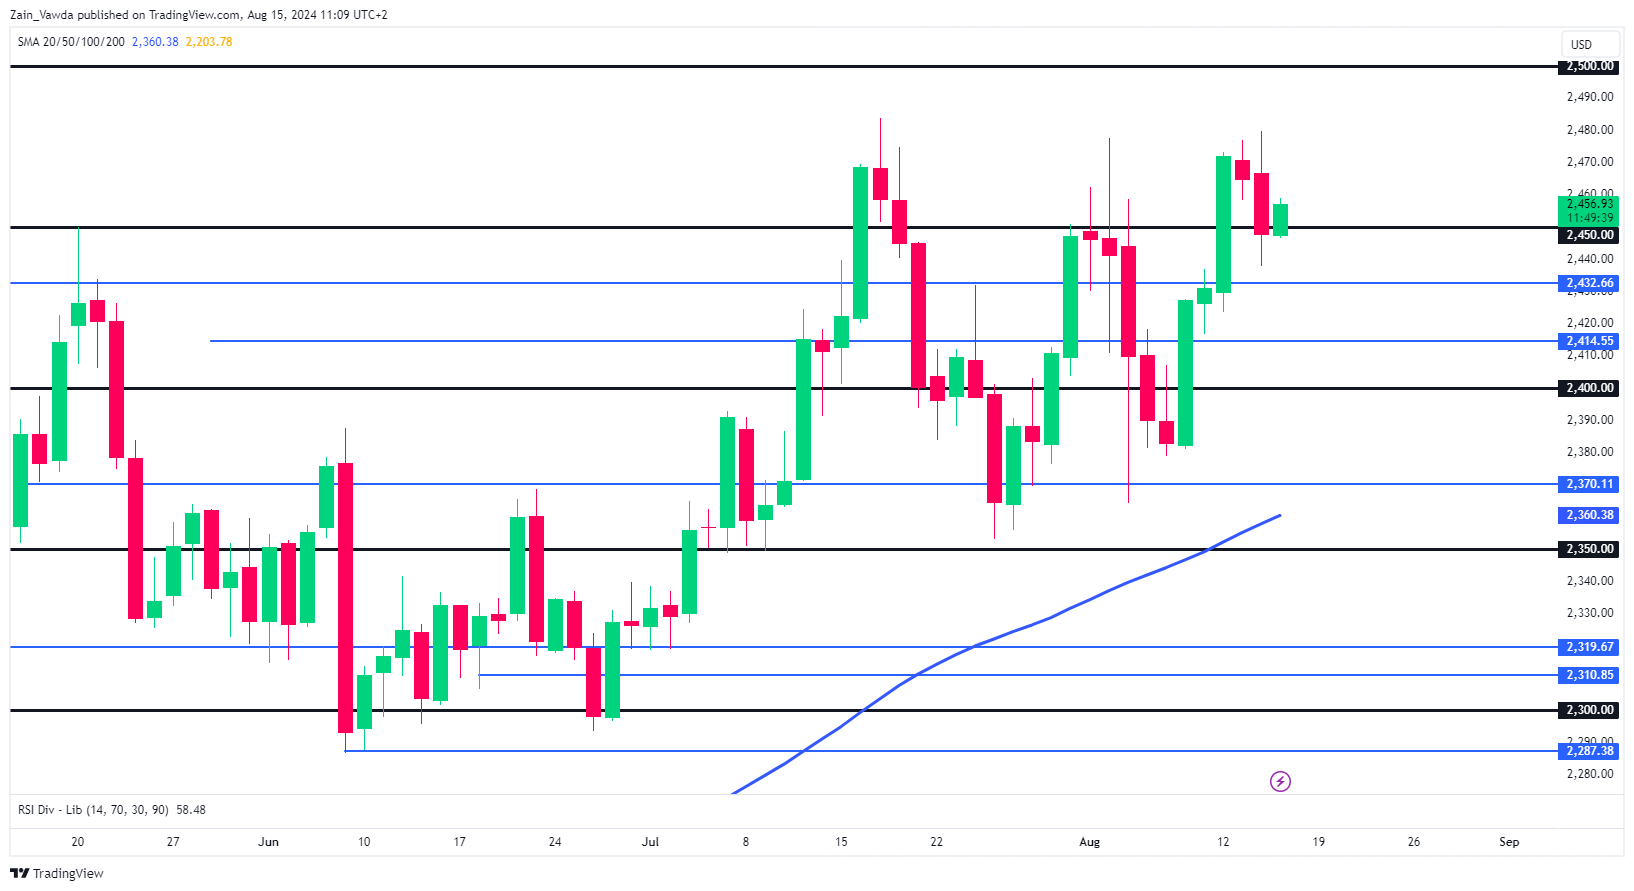
Source: TradingView (click to enlarge)
Support
- 2450
- 2438
- 2432
Resistance
- 2472
- 2480
- 2500