Hello fellow traders. In this technical article we’re going to take a quick look at the Elliott Wave charts of AUDCAD published in members area of the website. As our members know the pair has been showing incomplete sequences in the cycle from the February 2021 peak. Recently AUDCAD has given us the recovery that reached our selling zone. The pair found sellers right at the Blue Box area and made the decline toward new lows as expected. In the further text we are going to explain the Elliott Wave Forecast and trading strategy.
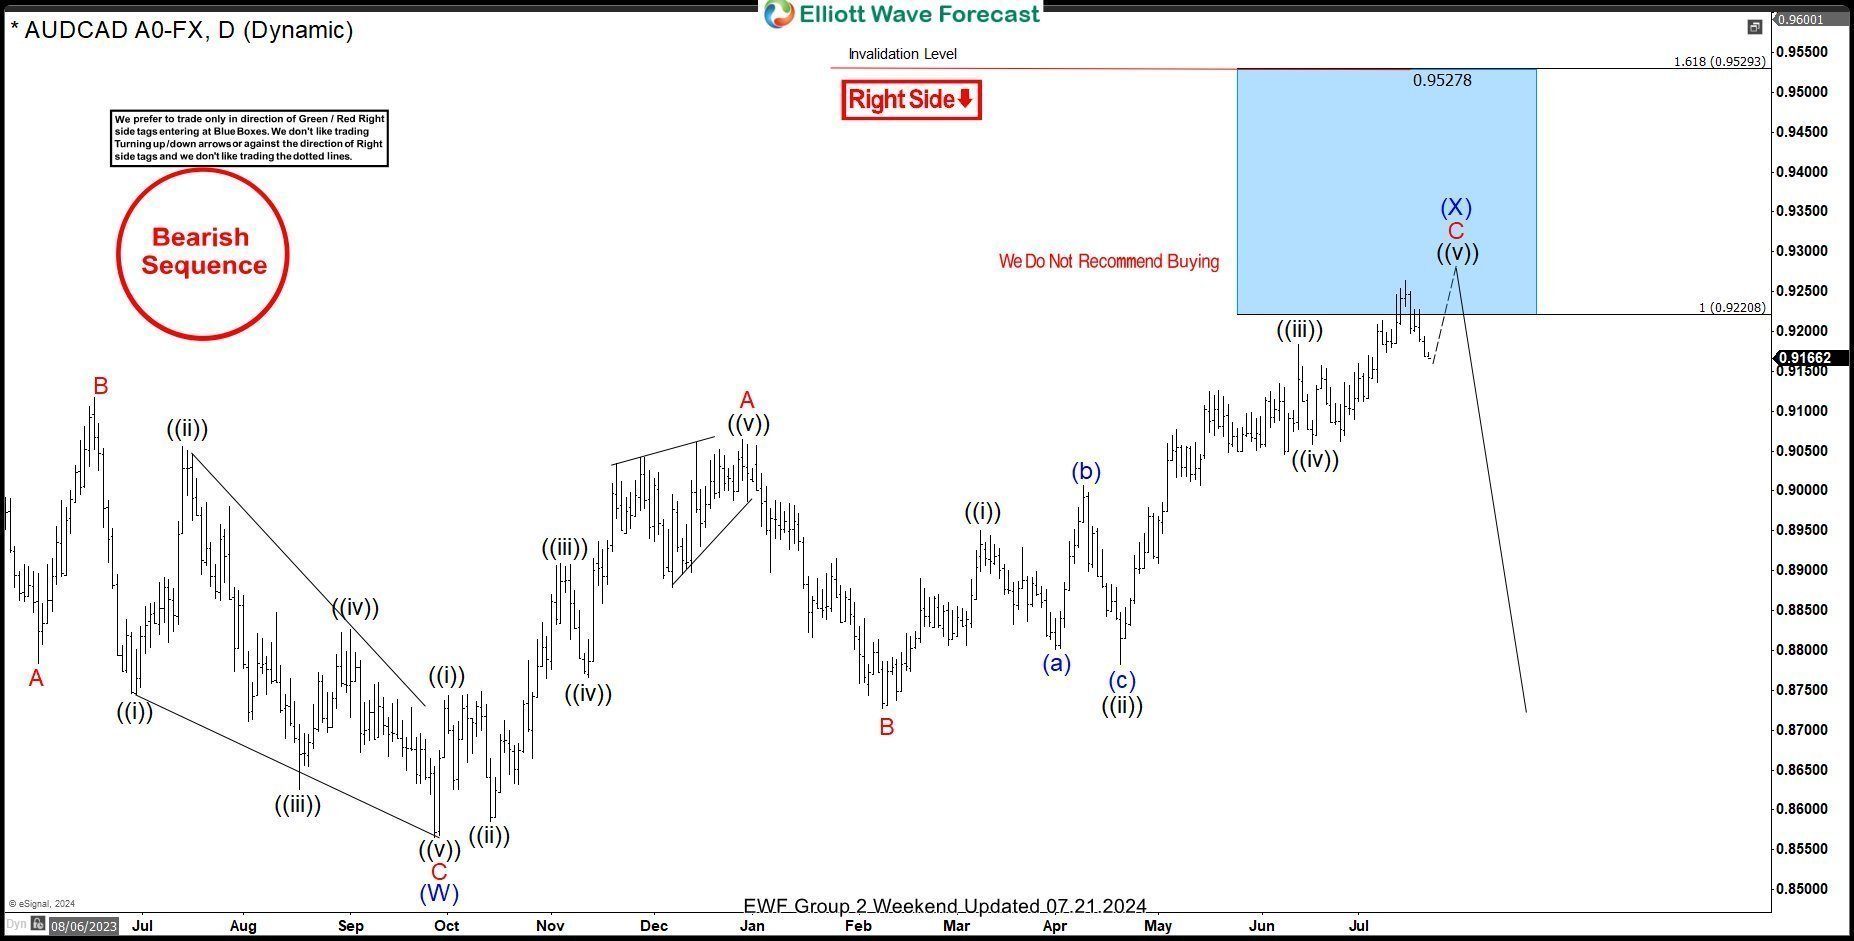
AUDCAD Elliott Wave Daily Chart 07.21.2024
The pair is correcting the cycle from the 25th January peak , giving us (X) blue recovery. The price has already reached the extreme zone at 0.92208-0.9529 (Blue Box – sellers zone). We don’t recommend buying the stock and prefer the short side from the blue box zone. As the main trend is bearish, we expect to see at least 3 waves pullback from our selling zone. Once the decline reaches 50 Fibs against the B red low, we will make the short position risk-free (put SL at BE) and take partial profits.
Quick reminder:
Our charts are easy to trade and understand:
Red bearish stamp+ blue box = Selling Setup
Green bullish stamp+ blue box = Buying Setup
Charts with Black stamps are not tradable. 🚫
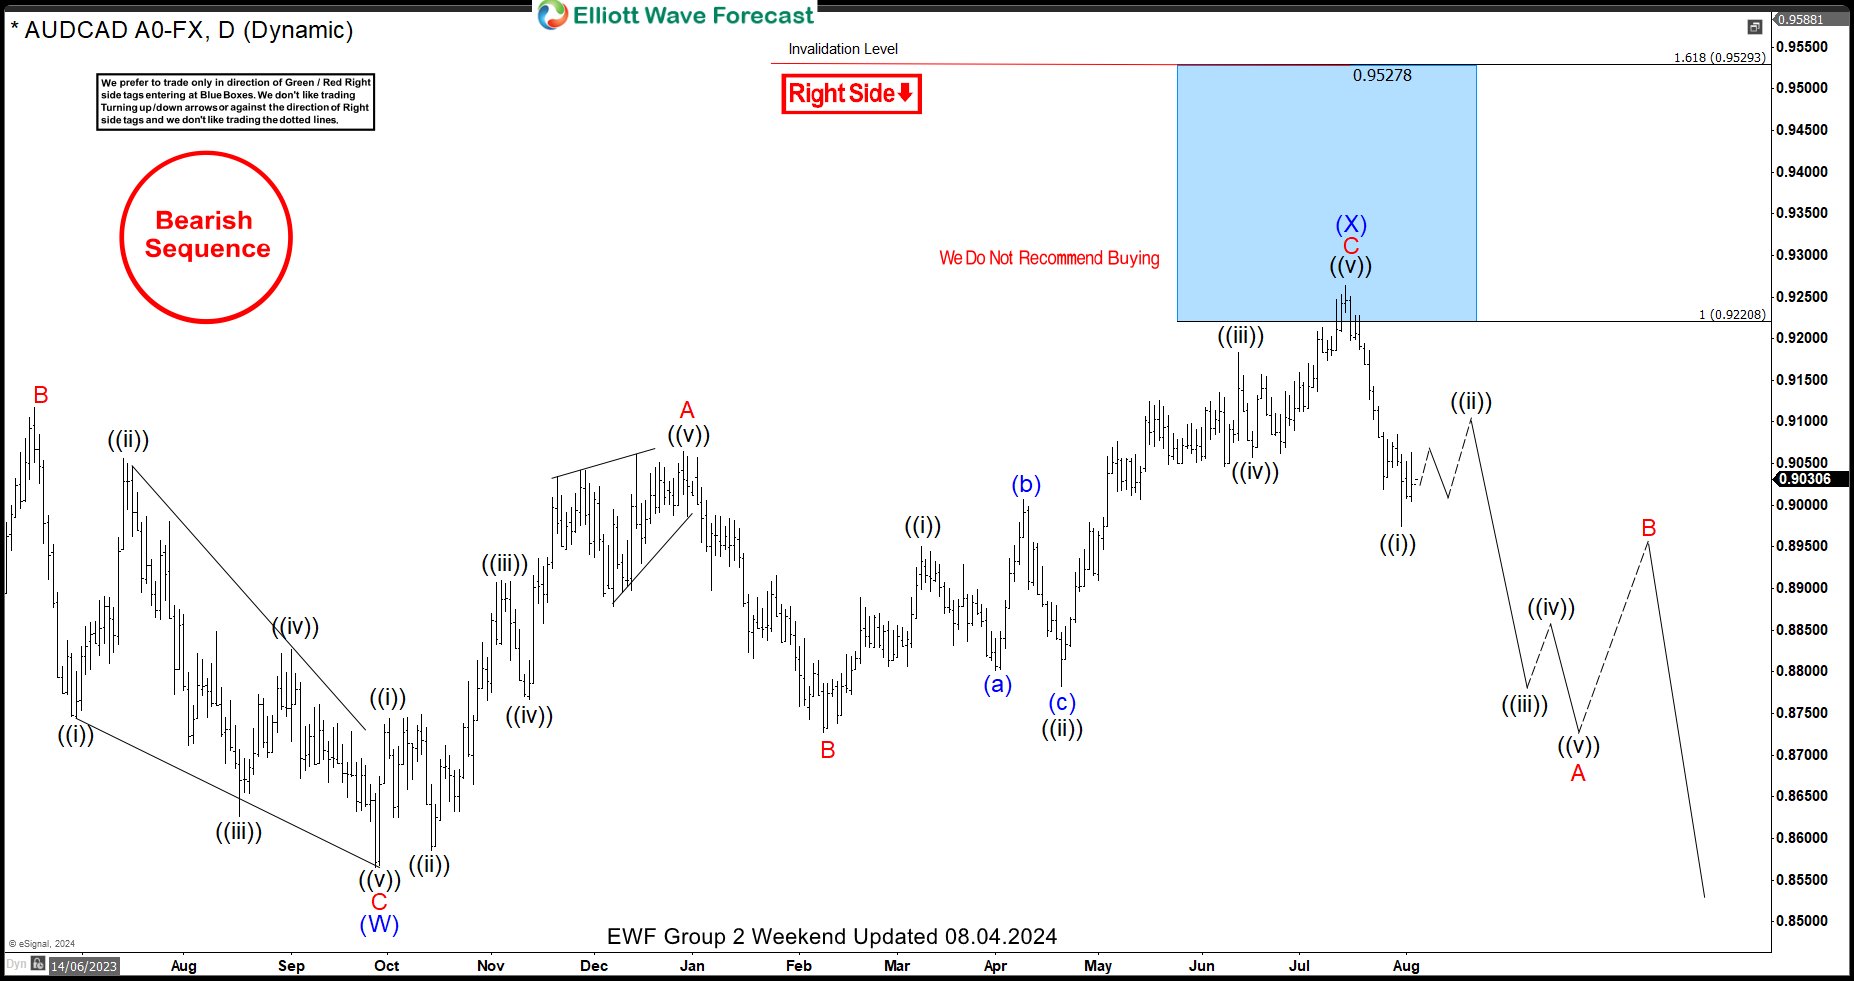
AUDCAD Elliott Wave Daily Chart 08.04.2024
AUDCAD found sellers at the Blue Box area: 0.92208-0.952728. We are receiving a good reaction from the selling zone. The decline made has reached and exceeded 50 Fibs against the B red low. So, members who took the short trade are currently enjoying profits in risk-free positions.