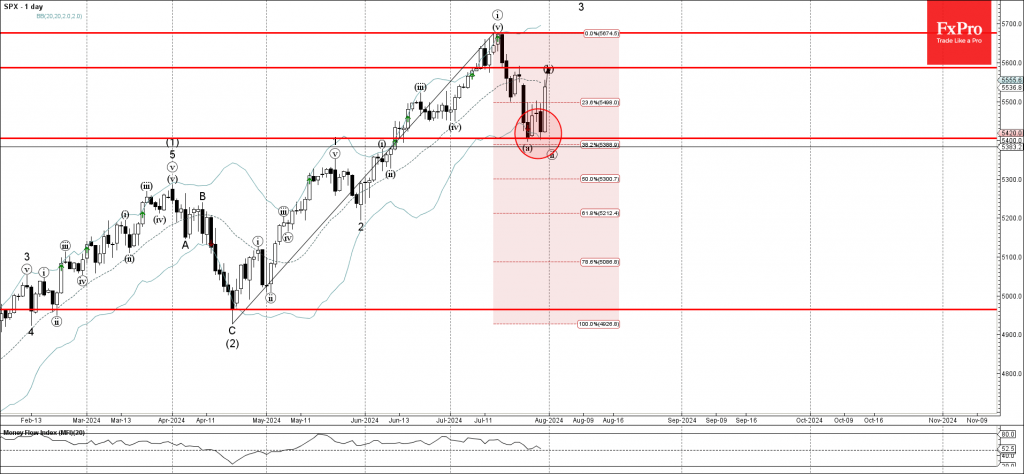
- S&P 500 index reversed from support zone
- Likely to rise to resistance level 5585.00
S&P 500 index recently reversed up from the support zone located between the support level 5400.00, daily Bollinger Band and the 38.2% Fibonacci correction of the upward impulse from April.
The upward reversal from this support zone formed the second daily Japanese candlesticks reversal pattern Bullish Engulfing.
Given the overdoing daily uptrend, S&P 500 index can be expected to rise further toward the next resistance level 5585.00 – target price for the completion of the active wave (b).