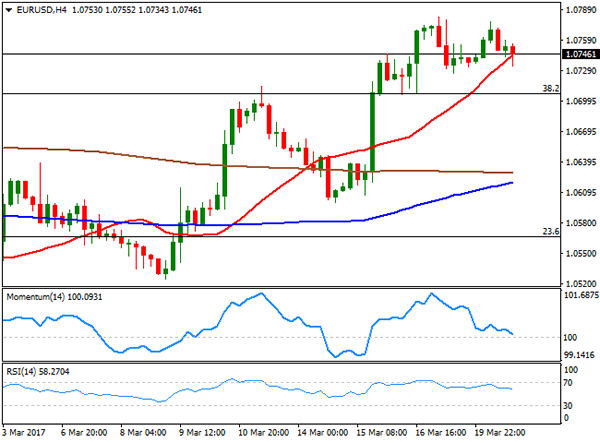
EUR/USD
Major pairs closed the day little changed, as a Japanese holiday and a light macroeconomic calendar kept investors in cautious mode. The dollar recovered from an early slide, underpinned by news that the Brexit has an official date: March 29th. Nevertheless, the greenback retains the week tone triggered last week by the US Fed, settling against the EUR at 1.0738. There were some minor releases in Europe, including wage growth, which increased in the last quarter of 2016 to 1.6% from a previous downwardly revised 1.4%, a sign that underlying price pressures are still weak in the region. Also, Germany released its February PPI data, which came in as expected, up 0.2% in February when compared to the previous month, and by 3.1% yearly basis, beating expectations of a 2.9% advance. In the US, Fed’s Evans repeated what the market already knew that three hikes are possible for this year as policy makers are confident on inflation going up.
US President Trump is set to speak at a rally at the Kentucky Exposition Center, in Louisville at the beginning of the Asian session, but the macroeconomic calendar will remain scarce at both shores of the Atlantic on Tuesday.
From a technical point of view, the intraday movement seems barely corrective, as the price held above the immediate short term support at 1.0730, and the 4 hours chart shows that the price is a few pips above a bullish 20 SMA, although technical indicators head south within positive territory, with the Momentum about to cross its mid-line towards the downside. It would take a break below 1.0700 however, to confirm a downward move, while only beyond 1.0785, the pair will be able to regain its upward strength.
Support levels: 1.0730 1.0700 1.0660
Resistance levels: 1.0785 1.0820 1.0850
USD/JPY
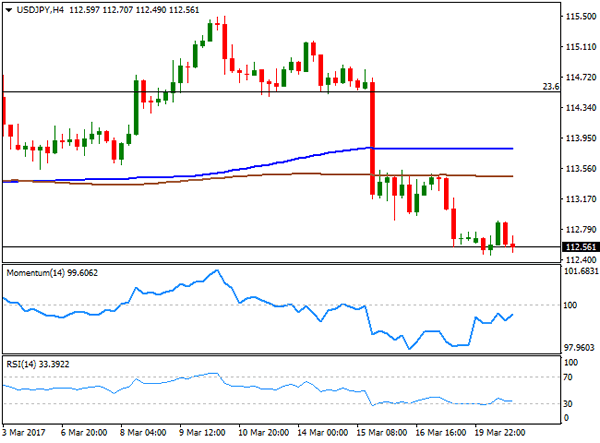
The USD/JPY pair extended its multi-week decline by a few pips to 112.45 at the beginning of the week, ending the day not far above it and having topped for the day at 112.89. The Japanese yen appreciated as US Treasury yields kept falling this Monday, with the 10-year benchmark down to 2.48% from previous 2.50%. There are no news scheduled in Japan for the upcoming Asian session, which means that the pair will likely continue trading on sentiment. From a technical point of view, the risk remains towards the downside, as the price held well below its 100 and 200 SMAs both still horizontal far above the current level in the 4 hours chart, whilst the RSI indicator holds flat at oversold levels and the Momentum hovers back and forth below its 100 line. A downward acceleration below 112.50 should see the pair nearing the 112.00 level, where the pair has the 38.2% retracement of its late 2016 monthly rally, with scope to extend afterwards towards the 111.60 region, where the pair bottomed multiple times this year.
Support levels: 112.50 112.10 111.65
Resistance levels: 113.05 113.50 114.00
GBP/USD
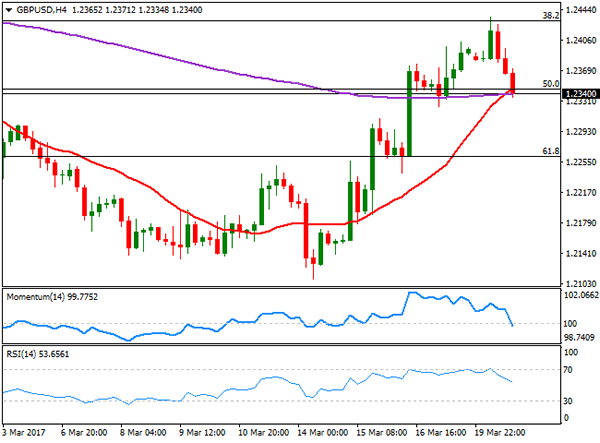
The British Pound was the best performer this Monday, plunging from 1.2435 to 1.2334 following news indicating that the UK government will trigger the Brexit process next March 29, starting a two-year time frame to get a smooth deal that satisfies both parts. Following the announcement, EU Commission chief spokesman Margaritis Schinas said at a briefing in Brussels that the EU is ready to begin talks "immediately" and that they had a comprehensive plan in place. The GBP/USD pair settled for the day a couple of pips below 1.2345, a major Fibonacci support and February’s low, while in the 4 hours chart, the price is also battling around a bullish 20 SMA and technical indicators have retreated sharply, with the Momentum indicator already within bearish territory and the RSI heading south around 54, all of which increases chances of a downward extension for the upcoming sessions. The UK will release multiple inflation figures this Tuesday, including PPI, CPI and retail price indexes for February, all of which will set the tone for the Pound probably for the next of the week.
Support levels: 1.2345 1.2300 1.2260
Resistance levels: 1.2425 1.2470 1.2510
GOLD
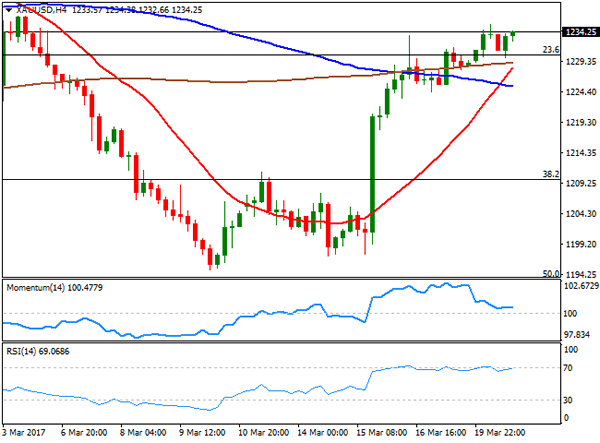
Gold prices edged higher this Monday, with spot settling at $1,234.12 a troy ounce, its highest settlement for this March. Prices for the commodity held firm, underpinned by a US Fed that’s in no rush to raise rates and political uncertainty in the EU. A light macroeconomic calendar kept volumes low, but the commodity managed to recover above the 1,230.10 level, the 23.6% retracement of the December/February rally, now the immediate support. In the daily chart, the metal has also surpassed its 20 DMA, whilst technical indicators have extended their recoveries, now heading modestly higher within neutral territory. The 200 DMA stands at 1,249.25 a critical mid-term dynamic resistance as the indicator has rejected advances since early November 2016. Shorter term, and according to the 4 hours chart, the commodity has room to advance further, as the20 SMA has accelerated north below the current level, having already crossed above the 100 SMA and about to cross the 200 SMA, whilst the RSI indicator consolidates around 68 and the Momentum indicator turned flat above its 100 level, after correcting extreme overbought conditions.
Support levels: 1,230.10 1,223.15 1,212,90
Resistance levels: 1,242.50 1,249.25 1,255.60
WTI CRUDE
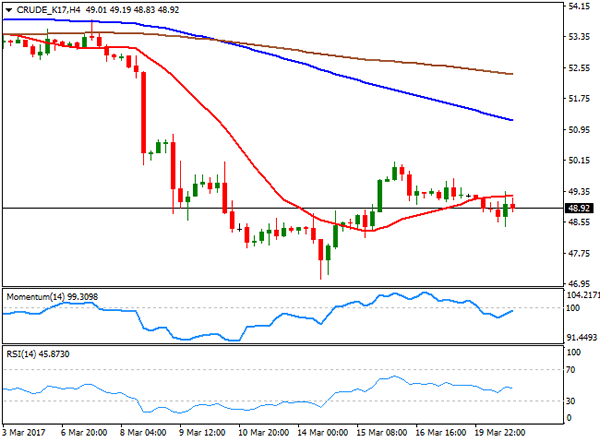
West Texas Intermediate crude oil futures settled at $48.92 a barrel after trading as low as 48.45, still pressure by concerns about rising US production. There were no major news affecting the oil market, although there were some comments from sources within the OPEC, about the possibility that the organization could extend its output cut to the second half of the year. The news also indicates that OPEC oil producers will be more willing to do so if non-OPEC countries remains part of the initiative. From a technical point of view, the daily chart shows that the US benchmark has made little progress over the past 24 hours, still contained by selling interest around the 200 DMA and with technical indicators having modestly corrected oversold conditions before turning back south. In the 4 hours chart, oil is trading below a modestly bullish 20 SMA, whilst technical indicators hold within negative territory, with no certain directional strength.
Support levels: 48.00 47.30 46.65
Resistance levels: 49.20 49.75 50.50
DJIA
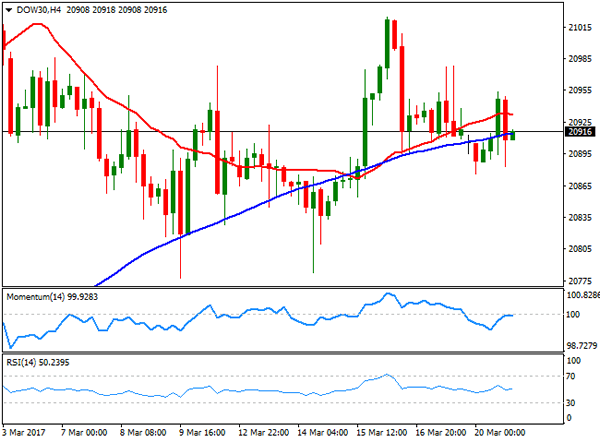
US indexes closed the day little changed, with the Dow Jones Industrial Average down by 9 points, to 20,905.51, the S&P 4 points lower, to 2,373.47, and the Nasdaq Composite flat again at 5,901.53. Within the Dow, Caterpillar led advancers, adding 2.63%, followed by Nike that closed up 1.57% and Nike that added 1.0%. Hole Depot was the worst performer, closing 1.19% lower, followed by Visa that shed 1.10%. Financials and pharmaceutical equities also closed in the red, following the lead of their European counterparts. In the daily chart, the index remains stuck around a horizontal 20 SMA, while the Momentum indicator have turned flat right below its 100 level and the RSI indicator consolidates around 63. In the 4 hours chart, the index retains a neutral stance, hovering around horizontals 20 and 100 SMAs, and with technical indicators heading nowhere around their mid-lines.
Support levels: 20,890 20,852 20,817
Resistance levels: 20,925 20,978 21,015
FTSE 100
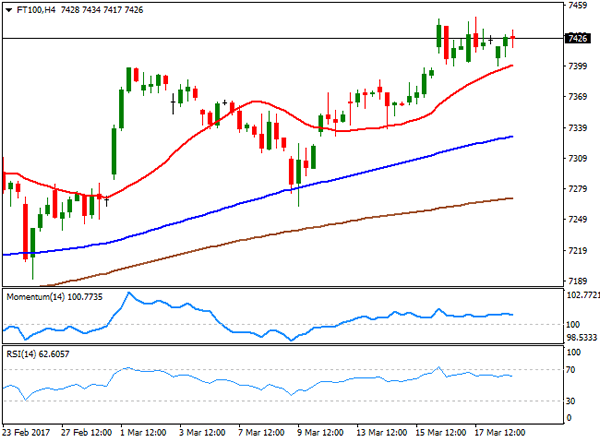
London shares´ market posted a modest gain this Monday, with the FTSE 100 recovering 4 points to settle at 7,429.81, in a lackluster start to the week. Royal Bank of Scotland was the worst performer, down 1,64%, followed by Hikma Pharmaceuticals that lost 1.57% after investment bank Merrill Lynch downgraded the stock to "neutral." Mining-related shares closed mixed, with Anglo American down 1.04%, but Randgold Resources adding 1.20% and Fresnillo 1.13%. From a technical point of view, the daily chart, shows that the benchmark maintains a neutral-to-bullish stance, as it holds near its recent record highs and above all of its moving averages in the daily chart, but with technical indicators still horizontal within positive territory. In the 4 hours chart, the 20 SMA maintains its bullish slope and offers a dynamic support at 7,400, whilst technical indicators have turned modestly lower, but remain within positive territory, with not enough directional strength to confirm a downward corrective move.
Support levels: 7,400 7,363 7,338
Resistance levels: 7,447 7,480 7,510
DAX
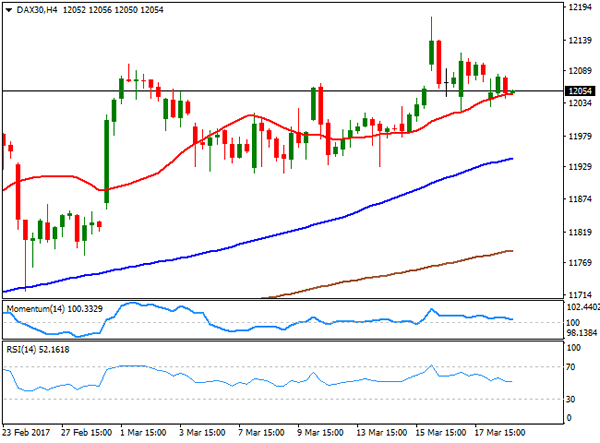
European equities closed mostly lower, with the German DAX shedding 42 points or 0.35% to settle at 12,052.90, weighed by a decline in automakers and banks. Deutsche Bank topped losers’ list, down 3.54%, followed by Commerzbank that shed 2.39%. Volkswagen was also among the worst performer, losing 0.88%. E.ON, on the other hand, was the best performer for a second consecutive day, adding 1.03%, followed by SAP that gained 0.80%. The daily chart for the DAX shows that the index held above a bullish 20 SMA, while technical indicators lost upward strength, having turned flat within positive territory, indicating a limited downward potential, despite the absence of upward strength. In the shorter term, and according to the 4 hours chart, the index is struggling around a bullish 20 SMA whilst technical indicators have continuing easing within positive territory, but losing their bearish strength near their mid-lines, in line with the longer term perspective.
Support levels: 12,039 11,977 11,932
Resistance levels: 12,105 12,140 12,178
