
- USD/CAD has been range-bound, reflecting US Dollar Index consolidation and potential rate differential between Canada and the US.
- Canada’s volatile inflation and struggling labor market increase pressure on the Bank of Canada (BoC).
- USD/CAD is positioned between key moving averages, with a tight range suggesting a potential breakout following the inflation data.
USD/CAD has been confined to a 50-pip range since July 4, reflecting the historical price action and recent consolidation of the US Dollar Index.
The potential for a rate differential between Canada and the US is growing. The US economy has experienced three consecutive declines in headline inflation, contrasting with Canada’s choppy inflation since February, where declines have alternated with increases. This volatility poses a significant challenge for the Canadian Central Bank.
Canada’s labor market is also under strain, further complicating the Central Bank’s decisions. Market expectations for a rate cut are rising; however, if the Central Bank cuts rates while inflation remains elevated, it could lead to significant issues. Markets currently price in a 65.1% chance of a cut at the upcoming BoC meeting on July 24, 2024. A rate cut ahead of the Fed, combined with an unstable inflation picture, could propel USD/CAD to new yearly highs.
Bank of Canada (BoC) Interest Rate Probabilities.
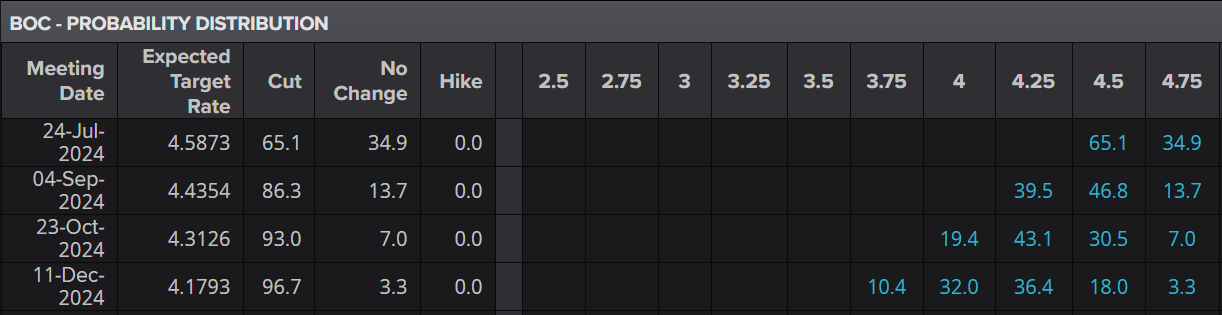
Source: The Kobeissi Letter
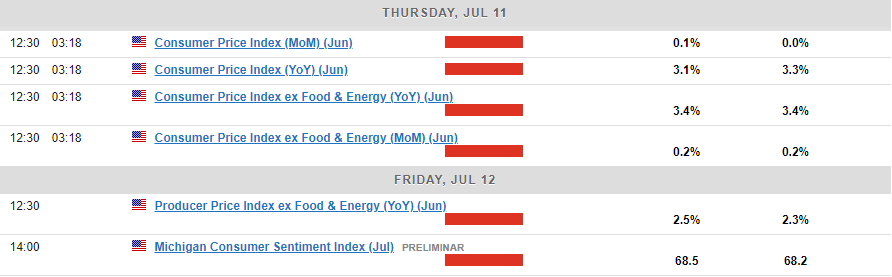
US CPI Data
The focus this week has primarily been on the upcoming US inflation release. The data is expected to show that headline inflation moderated to 3.1% in June, down from 3.3%.
A result in line with or below the consensus figure should maintain interest among US Dollar doves. Such a print would likely keep rate cut probabilities at current levels or even increase them, potentially surpassing the 80% mark.
Technical Analysis
From a technical perspective, USD/CAD has remained within a 50-pip range over the past five trading days. Similarly, the US Dollar Index has shown comparable price action as market participants await a potential catalyst.
USD/CAD is currently situated between the 100-day moving average, providing resistance at 1.3640, and the 200-day moving average, offering support at 1.3596. This tight range and consolidation often precede an explosive or impulsive move, which could occur following today’s inflation data.
Support
- 1.3596 (200-day MA)
- 1.3500 (psychological level)
- 1.3450
- 1.3370 (February swing low)
Resistance
- 1.3640
- 1.3736
- 1.3846
- 1.4000 (Psychological level)
USD/CAD Daily Chart, July 11, 2024
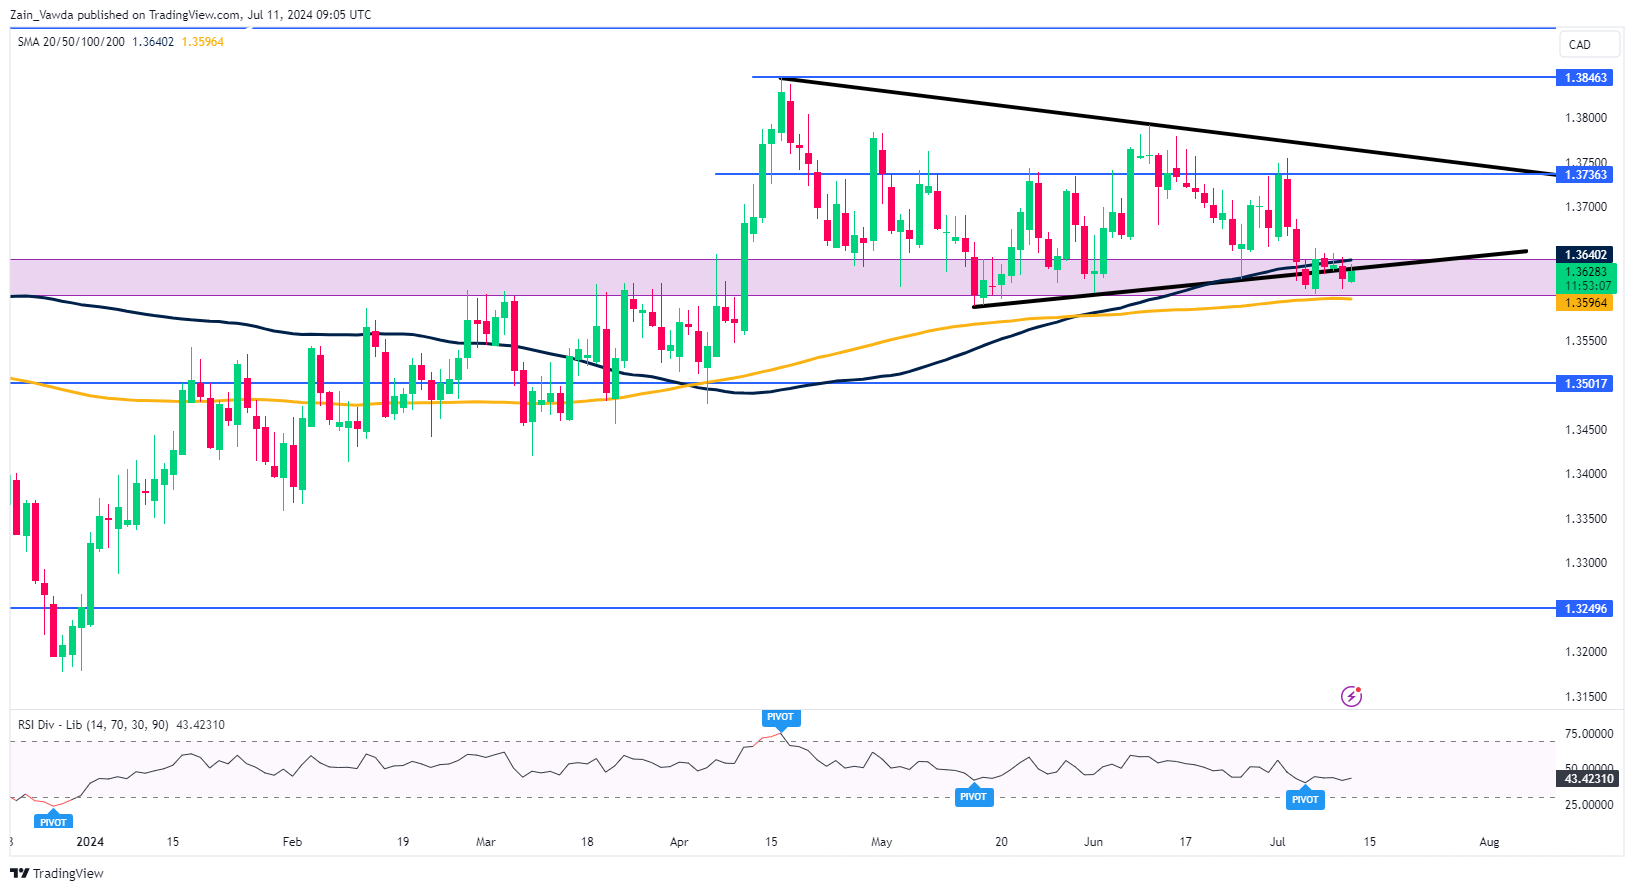
Source: TradingView.com (click to enlarge)