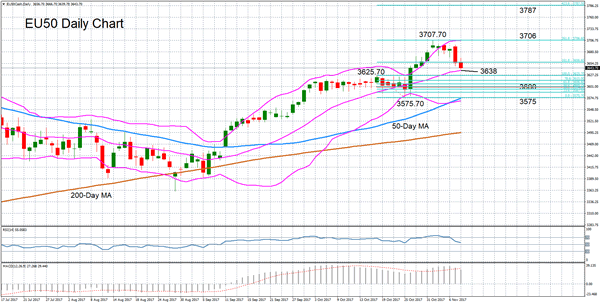
The EU 50 stocks index has turned bearish in the short term after the recent upleg became overstretched. The RSI is trending down after scaling overbought levels, pointing to a downside momentum in the near term.
Further losses could see prices finding immediate support from the middle Bollinger band at 3638. A move to the lower channel of the Bollinger bands would strengthen the negative bias and open the way towards the 3600 level, which is the 50% Fibonacci retracement of the downleg from 3625.70 to 3575.70. Further declines would likely see strong support being formed around the 50-day moving average and the lower Bollinger band in the 3570-75 region. A breach of this region would risk shifting the current bullish medium-term outlook to neutral.
The bullish structure has weakened somewhat as indicated by the MACD sliding below its signal line, though with price action firmly above the moving averages, it remains intact for now. A resumption of the uptrend should see resistance coming at the 261.8% Fibonacci retracement level at just above 3700, which also coincides with the upper Bollinger band. A break above that level would take the index to fresh 2-year highs to the 423.6% Fibonacci level at 3787 and towards its 2015 peak of 3835.20

