
- Yesterday’s lacklustre US ISM services PMI and ADP employment data for June increases the odds of a further US Treasury yield curve un-inversion.
- A further un-inversion above -0.08% on the US Treasury yield spread between 10-year & 2-year may trigger a bull steepening scenario.
- A potential bull steepening in the US Treasury yield curve may see an outperformance of the value factor, in turn, trigger a bullish breakout in the Dow Jones Industrial Average (DJIA).
Since the start of the year, the venerable Dow Jones Industrial Average has lagged where it underperformed the high-flying Nasdaq 100 and the S&P 500 which continued to print fresh all-time highs.
As of Wednesday 3 July, the Dow Jones Industrial Average (DJIA) year-to-date gain stood at a meagre 4.22% and has underperformed significantly against the double-digit gains seen in the Nasdaq 100 and S&P 500 which recorded stellar returns of 22.02% and 16.75% respectively over the same period.
K-shaped performance between DJIA & Nasdaq 100, S&P 500
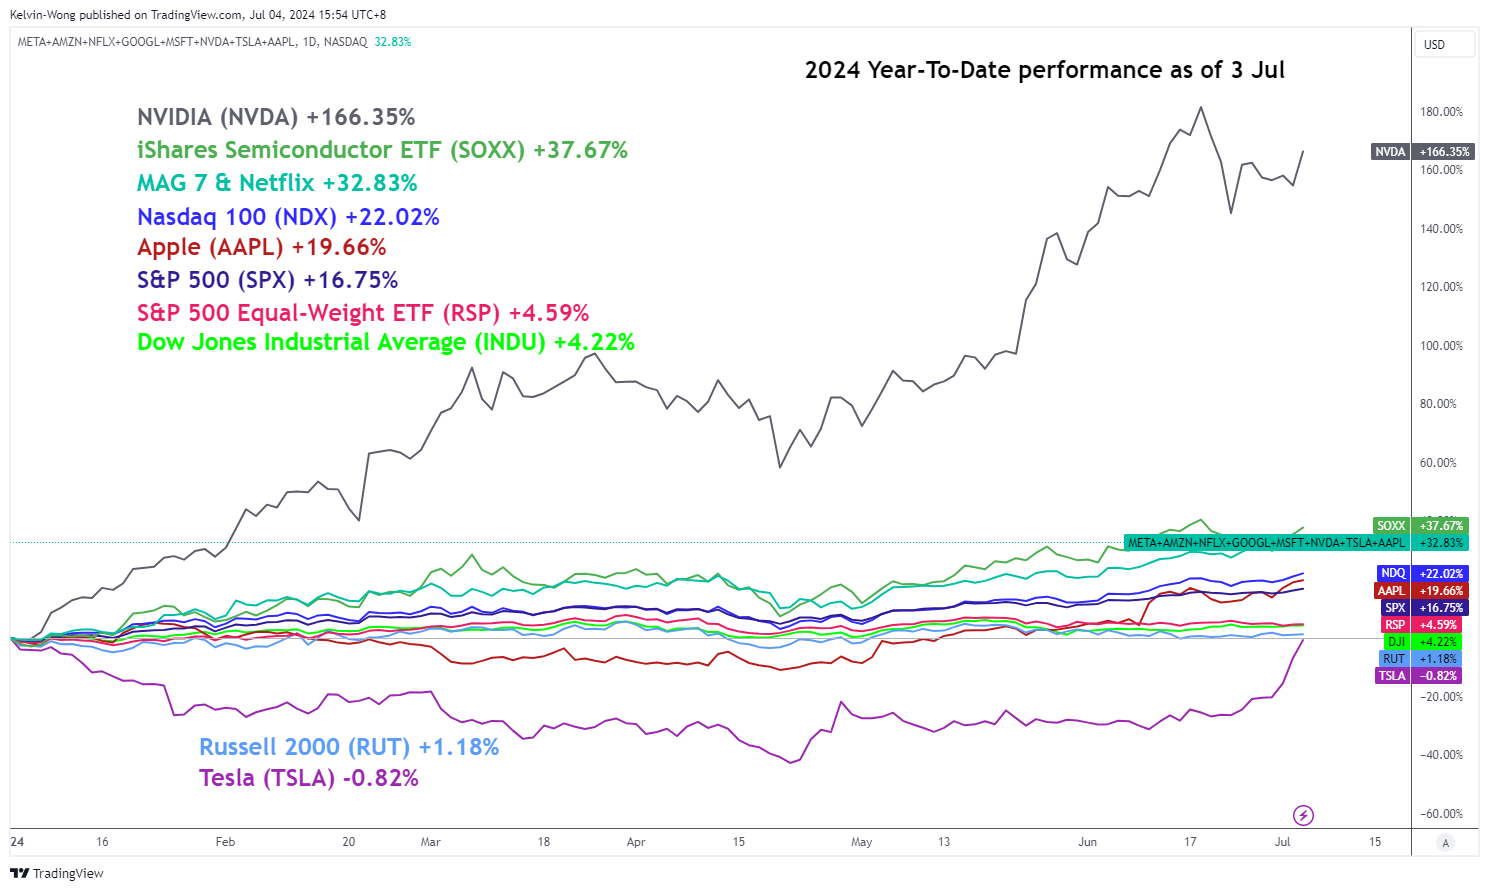
Fig 1: 2024 YTD performance of major US stock indices with mega-cap stocks as of 3 Jul 2024 (Source: TradingView, click to enlarge chart)
The primary catalyst of the strong outperformance seen in the Nasdaq 100 and S&P 500 is due to the persistent positive momentum factor inherent only in a handful of technology mega-capitalization component stocks riding on the current artificial intelligence (AI) positive feedback loop wave such as AI-GPU chip juggernaut, Nvidia that has a magnificent year-to-day rally of 166% followed, Microsoft, Meta, Alphabet, Amazon, and Apple with the introduction of a new AI-powered iPhone model.
The lack of love for value factor is the main drag on the DJIA performance
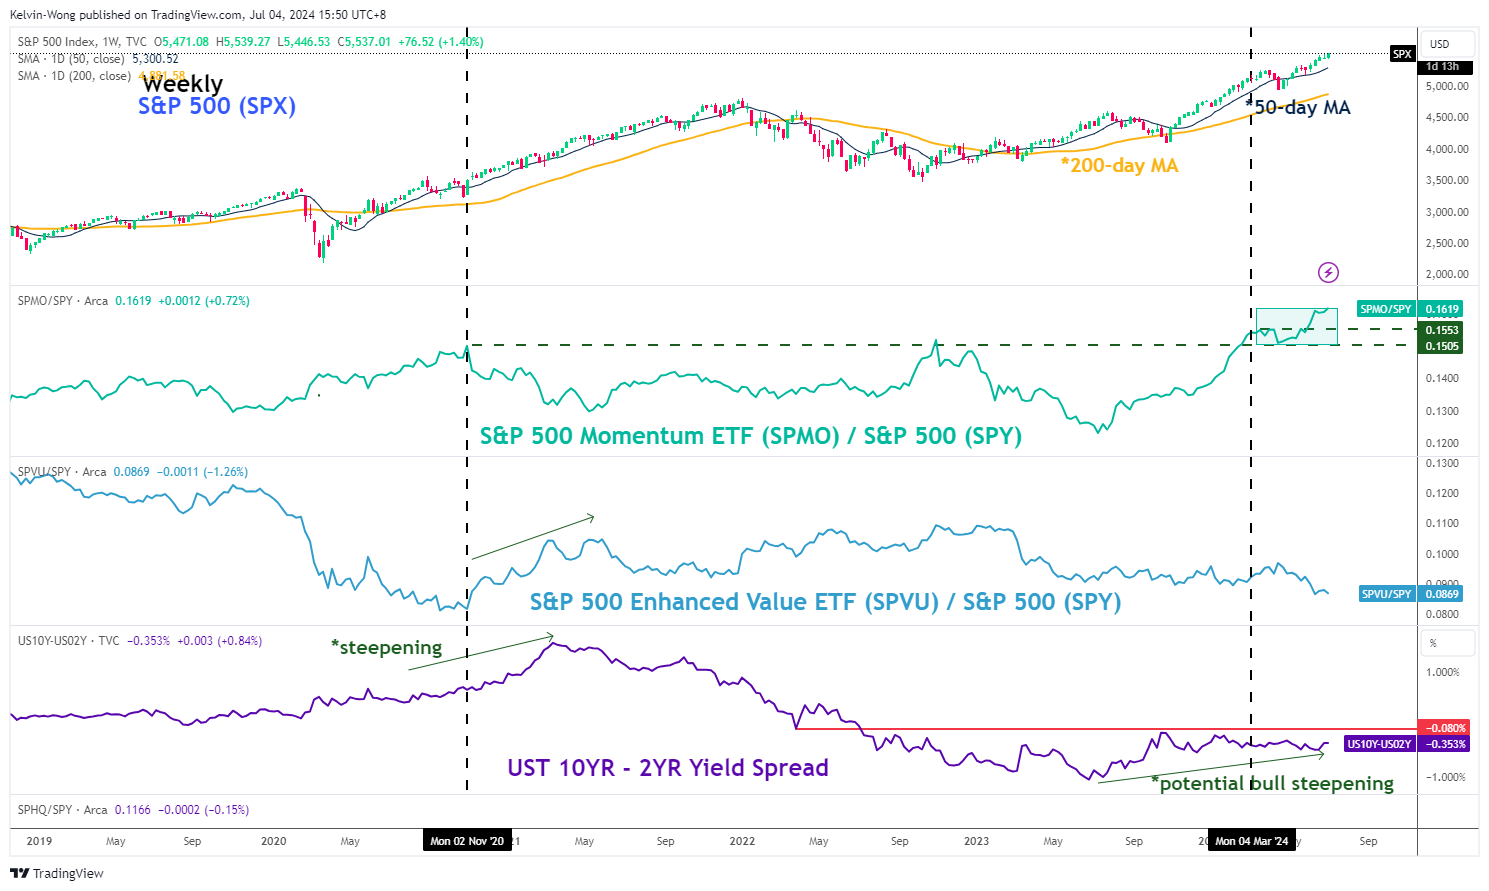
Fig 2: Relative strength of S&P Momentum & Value ETFs with UST 2-10 yield curve as of 3 Jul 2024 (Source: TradingView, click to enlarge chart)
The DJIA has only three technology titans; Microsoft, Apple and Amazon as part of its 30 component stocks but it is heavily weighted toward value-oriented financials, industrials, and healthcare stocks.
The value factor has not been in favour and the darling of the US stock market since January 2023. The relative strength (ratio chart) of the S&P 500 Enhanced Value exchange-traded fund (re-ranked according to value factor; components stocks that have higher value scores will have a higher weightage) over the S&P 500 has continued to oscillate in a downtrend phase (see Fig 2).
In contrast, the S&P 500 Momentum ETF has outperformed the S&P 500 in the past year and continued to print a series of fresh all-time highs since early March 2024 as seen from its relative strength chart.
Hence, the current persistent underperformance trend of the value factor has caused the performance of the DJIA to fall behind the Nasdaq 100 and S&P 500. But the fortune of the DJIA may soon reverse after the release of yesterday’s lacklustre US ISM services PMI and ADP employment data for June.
Weak ISM services PMI & ADP employment may trigger a bull steepening in the UST yield curve
The US Treasury yield curve (measured by the difference between the 10-year US Treasury yield over the 2-year US Treasury yield) has been in an inverted condition (below 0%) since early July 2022.
Interestingly, the pace of the yield curve inversion has started to lose its momentum (un-invert) since December 2023 coupled with a contraction reading seen in the June US ISM services PMI where it tumbled to 48.8, its sharpest contraction since April 2020, together with three consecutive months of jobs hiring slowdown as indicated by the ADP employment data.
The odds of a potential second interest rate cut by the US Federal Reserve during the December FOMC meeting have increased to an aggregate probability of 89% from around 70% chance a day earlier according to the CME FedWatch Tool at this time of the writing.
The risk of an impending slowdown in aggregate internal demand in the US economy sees an increased chance of two interest rates cut by the Fed before 2024 ends, in turn, increases the likelihood of a bull steepening scenario on the US Treasury yield curve as the 2-year Treasury yield being more sensitive to monetary policy is likely to decrease at a faster rate over the 10-year Treasury yield if the Fed revisits its “dovish pivot” playbook.
A bullish steeping scenario is likely to favour a potential outperformance in the value factor at least in the short to medium-term horizon.
The previous brief US Treasury yield curve steepening episode from August 2020 to March 2021 led to a relative strength outperformance of the S&P 500 Enhanced Value ETF over the S&P 500 (see Fig 2).
Thus, a break above the -0.08% of the US 10-year/2-year Treasury yield spread may trigger the potential bull steepening scenario, in turn, may see the laggard DJIA to catch up with its peers as the value factor starts to shine.
Bullish range consolidation detected in DJIA

Fig 3: US Wall Street 30 medium-term trend as of 4 Jul 2024 (Source: TradingView, click to enlarge chart)
Based on the current price actions of the US Wall Street 30 CFD Index (a proxy of the DJIA futures), it has started to evolve into a bullish “Ascending Triangle” range configuration in place since19 April 2024 according to a technical analysis perspective (see Fig 3).
Coupled with the current bullish momentum condition (higher lows above the 50 level) seen in the daily RSI momentum indicator; these positive technical elements suggest that the current three months of consolidation are skewed towards a “pause” of its ongoing major uptrend phase that remains intact since 3 October 2022.
A break above the 40,030 range resistance of the “Ascending Triangle” may trigger a potential fresh round of bullish impulsive upmove sequence for the next medium-term resistances to come in at 41,440 and 42,520/670.
On the other hand, failure to hold at the 37,150 key medium-term pivotal support invalidates the bullish bias to kickstart a potential multi-week corrective decline to expose the key long-term pivotal support at 34,940.