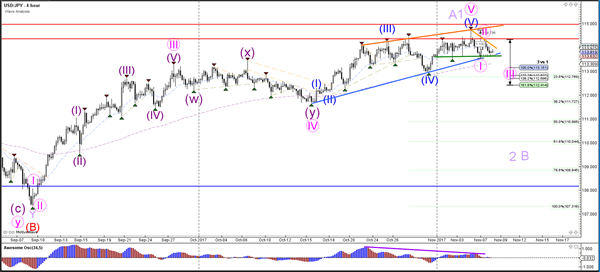
Currency pair USD/JPY
The USD/JPY failed again to break above the 114.50-115 resistance zone, which is a major break or bounce spot. A rising wedge reversal chart pattern is still present (blue/orange lines) and includes a divergence pattern between the tops (purple line). A break below support could indicate a larger bearish move whereas an uptrend continuation seems most likely above resistance (red)
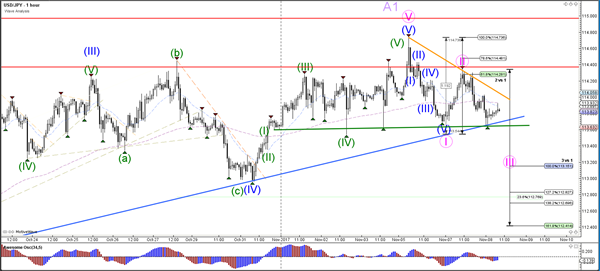
The USD/JPY is building a triangle pattern which is marked by support and resistance trend lines. A bullish break could see price retesting the previous top whereas a bearish break could see a wave 3 (pink) emerge.
Currency pair EUR/USD
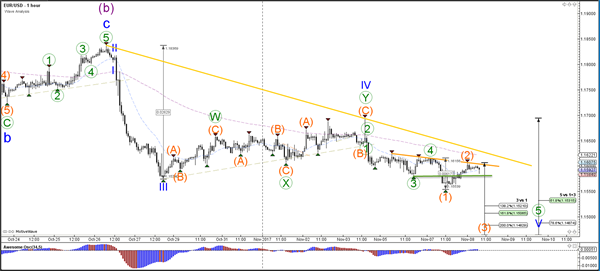
EUR/USD broke below the bottom (dotted green) but is now building a new retracement. A bullish break above the resistance trend lines could indicate a larger retracement. If price stays below it, then a bearish continuation towards the 38.2% Fibonacci level at 1.15 is still possible.
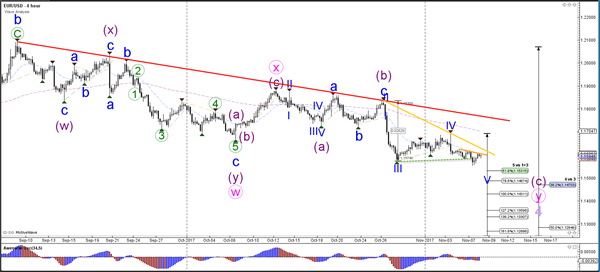
The EUR/USD seems to be building a wave 1-2 (orange) correction and a break below support (green) could see price continue with the downtrend.
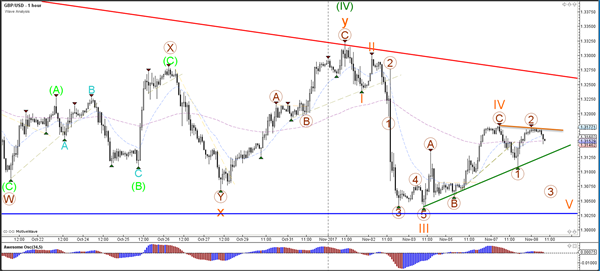
Currency pair GBP/USD
The GBP/USD is in a small and large wedge. A break below the support trend line (green) of the smaller triangle could see bearish breakout towards support (blue).
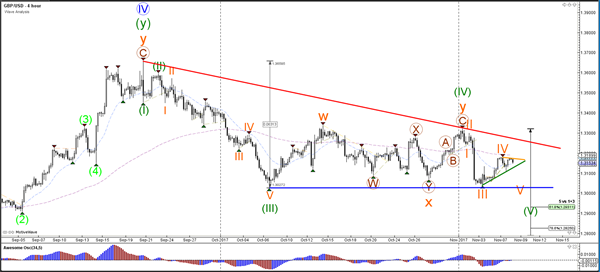
The wave 3 (brown) could occur if price shows bearish momentum and breaks the trend line.