
 is at 56 and trending downwards, indicating a slight drop in buying pressure. This is supported by the flat red bars on the Moving Average Convergence Divergence (MACD), which suggest a continuing consolidation pattern. Overall, the NZDUSD pair is experiencing resistance and consolidation after a brief rise.)
The NZDUSD pair climbed to a peak of 0.6217 before settling at 0.6170. The pair has faced resistance around the 0.6220 level, with attempts to break through being unsuccessful. On the daily chart, the Relative Strength Index (RSI) is at 56 and trending downwards, indicating a slight drop in buying pressure. This is supported by the flat red bars on the Moving Average Convergence Divergence (MACD), which suggest a continuing consolidation pattern. Overall, the NZDUSD pair is experiencing resistance and consolidation after a brief rise.
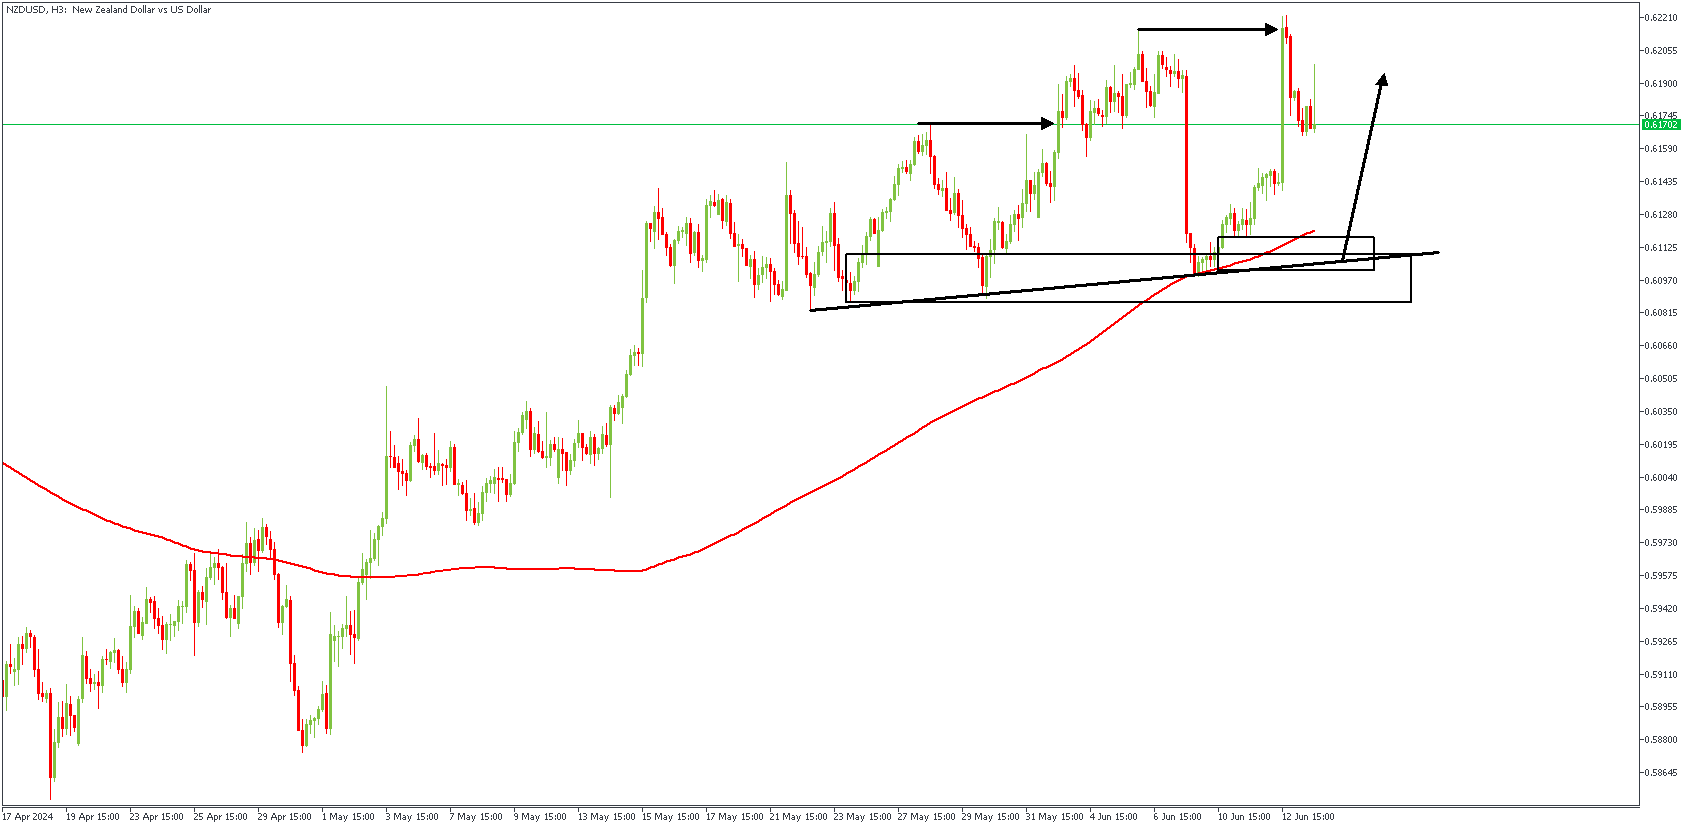
NZDUSD – H3 Timeframe
NZDUSD on the 3-hour timeframe chart broke two previous highs; creating a formidable demand zone that has already been tested once before. The addition of the 200-period moving average support into the mix adds the much-needed flavour in support of a bullish sentiment. Finally, the trendline support and the fact that all of these converge around the 88% of the Fibonacci retracement seems reason enough for a bullish reaction from the highlighted zone.
Analyst’s Expectations:
- Direction: Bullish
- Target: 0.61993
- Invalidation: 0.60937
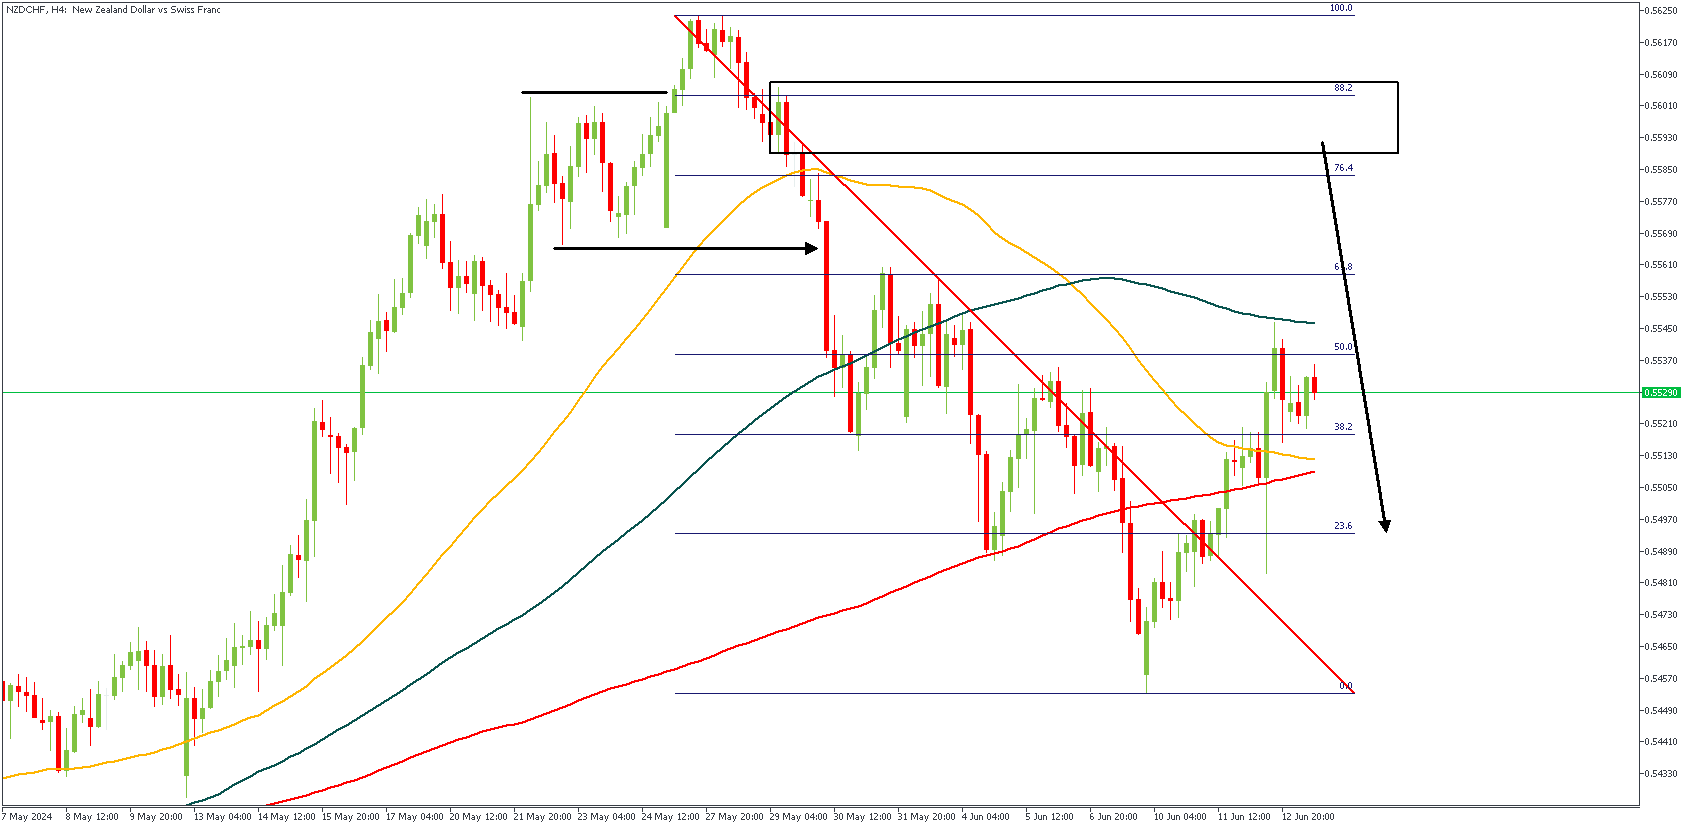
NZDCHF – H4 Timeframe
In my usual flow, I spotted this sweet trade idea on the 4-hour timeframe chart of NZDCHF. Breaking down the highlights on the chart, you would notice the previous high being swept clean of liquidity, after which the proper break of structure occurred. It is my expectation that the retracement of price into the supply zone area that aligns with the 88% of the Fibonacci retracement tool would yield the next bearish impulse.
Analyst’s Expectations:
- Direction: Bearish
- Target: 0.54846
- Invalidation: 0.56183
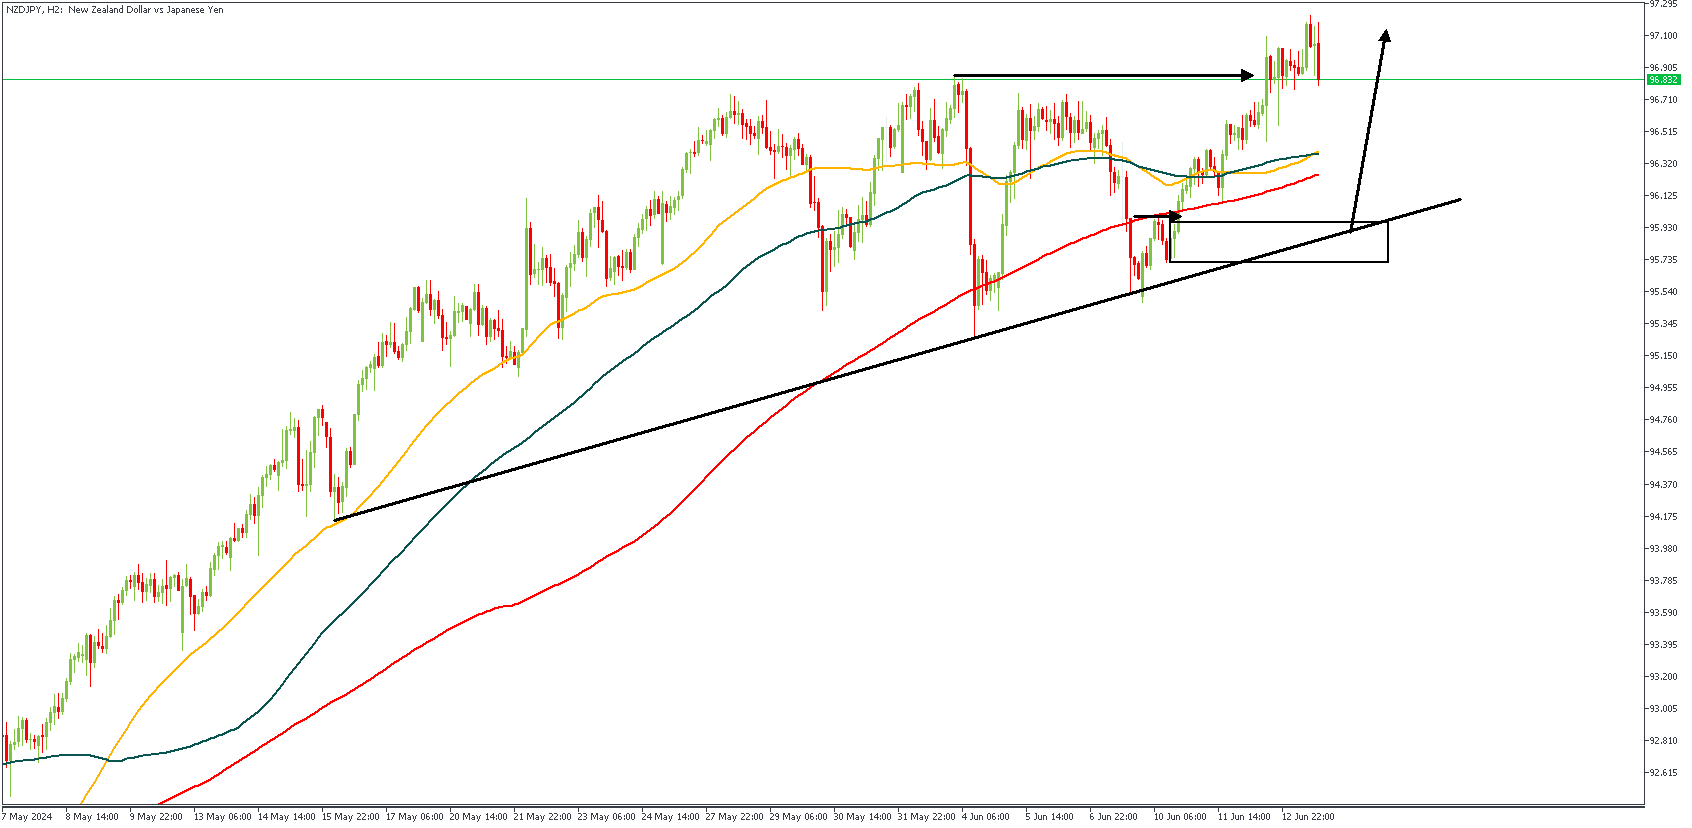
NZDJPY – H2 Timeframe
After making a clean breakout on the 2-hour timeframe chart, we see the price action on NZDJPY slowly grinding downwards in possible search of an area of demand from which new buyers could be lured in. The highlighted demand zone fits perfectly within the 88% Fibonacci retracement level, as well as the trendline support, thereby increasing my confluences in favor of a bullish sentiment.
Analyst’s Expectations:
- Direction: Bullish
- Target: 96.879
- Invalidation: 95.483
CONCLUSION
The trading of CFDs comes at a risk. Thus, to succeed, you have to manage risks properly. To avoid costly mistakes while you look to trade these opportunities, be sure to do your due diligence and manage your risk appropriately.