The US dollar fell across the board in immediate reaction to softer than expected US May inflation numbers, which revived hopes for Fed rate cut in September.
US m/m consumer prices were flat in May after 0.3% increase in April and annualized rose by 3.3% last month, compared to 3.4% rise previous month / forecast.
Core CPI, stripped for the most volatile components, was down to 0.2% in May m/m from 0.3% in April and 3.4% y/y from 3.6% previous month.
Softer than expected May figures provided relief to Fed policymakers, who signaled further delay in timing of the first rate cut, boosting bets for the first action by the central bank to be seen in September.
FOMC ends its two day policy meeting later today, with wide expectations to keep rates unchanged, but markets will focus more on the central bank’s projections, which will provide more details about Fed’s steps in coming months.
Soft CPI numbers soured dollar’s sentiment and prompted sharp selloff, which pushed the price of dollar index down by 0.6% in the first minutes after the data release.
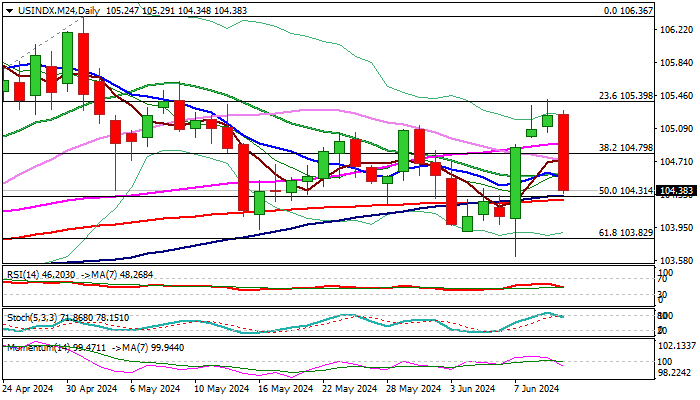
Fresh drop significantly weakened technical picture, with hourly and 4-h studies becoming firmly bearish, while the structure on daily chart significantly weakened.
Sharp post-data fall already retraced over 50% of 103.61/105.42 upleg, with rising negative momentum and stochastic reversing from overbought territory, generating strong bearish signal on daily chart.
Bears pressure key supports at 104.30 zone (daily cloud base / converged 100/200DMA’s / Fibo 61.8% of 103.61/105.42 rally), with clear break here to validate bearish signal and open way for fresh extension lower (103.90/103.61 are next targets).
However, bears may face increased headwinds here which may spark a partial profit-taking, with limited upticks to be seen as consolidation and positioning for continuation of the bear-leg from 105.42 (Jun 11 peak).
Barriers at 104.70/80 zone should ideally cap upticks and guard upper pivots at 105.00/18 (broken Fibo 50% / daily cloud top).
Res: 104.57; 104.75; 105.00; 105.18.
Sup: 104.30; 103.90; 103.61; 103.22.