


Hello fellow traders. In this technical article, we’re going to take a look into the Elliott Wave charts of SILVER (XAGUSD), exclusively presented in the members’ area of our website. As our members know SILVER has recently made pull back that made clear 3 waves down from the May 20th peak . The commodity completed correction right at the Equal Legs zone ( Blue Box Area) . In further text we’re going to explain the Elliott Wave pattern and trading setup.
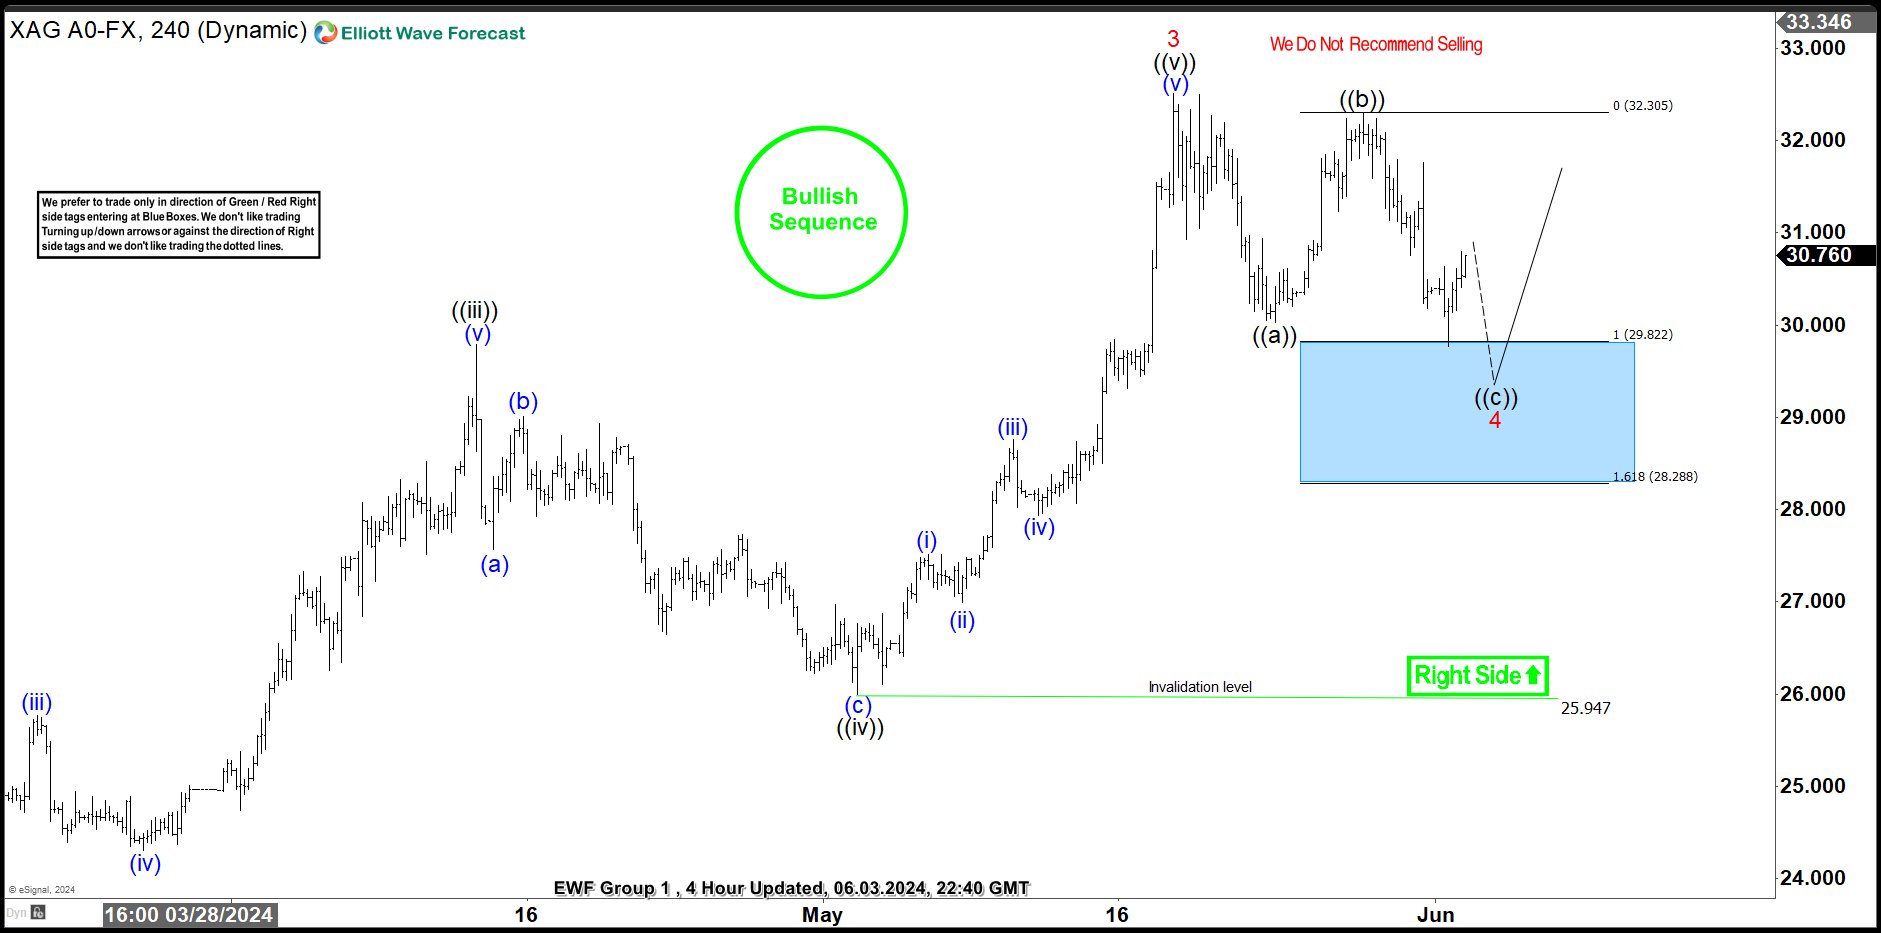
SILVER Elliott Wave 4 Hour Chart 06.03.2024
The commodity is giving us wave 4 red correction, that can be unfolding as Elliott Wave Zig Zag pattern. The pull back has already reached the extreme zone: 29.82-28.28 (Blue Box- buying zone) . However , we believe another marginal wave down still be seen within Blue Box to complete the pattern.
Despite the expected extension lower, we advise members to avoid selling SILVER. As the main trend is bullish, we expect to see either rally toward new highs or a 3 waves bounce alternatively. Once the bounce reaches the 50% Fibonacci retracement level against the connector high -((b)) black, we’ll secure our position by moving the stop-loss to breakeven. Break of 1.618 fib ext: 28.28 would invalidate the trade.
A quick reminder:
Our charts are designed for simplicity and ease of trading:
- Red bearish stamp + blue box = Selling Setup
- Green bullish stamp + blue box = Buying Setup
- Charts with Black stamps are deemed non-tradable.

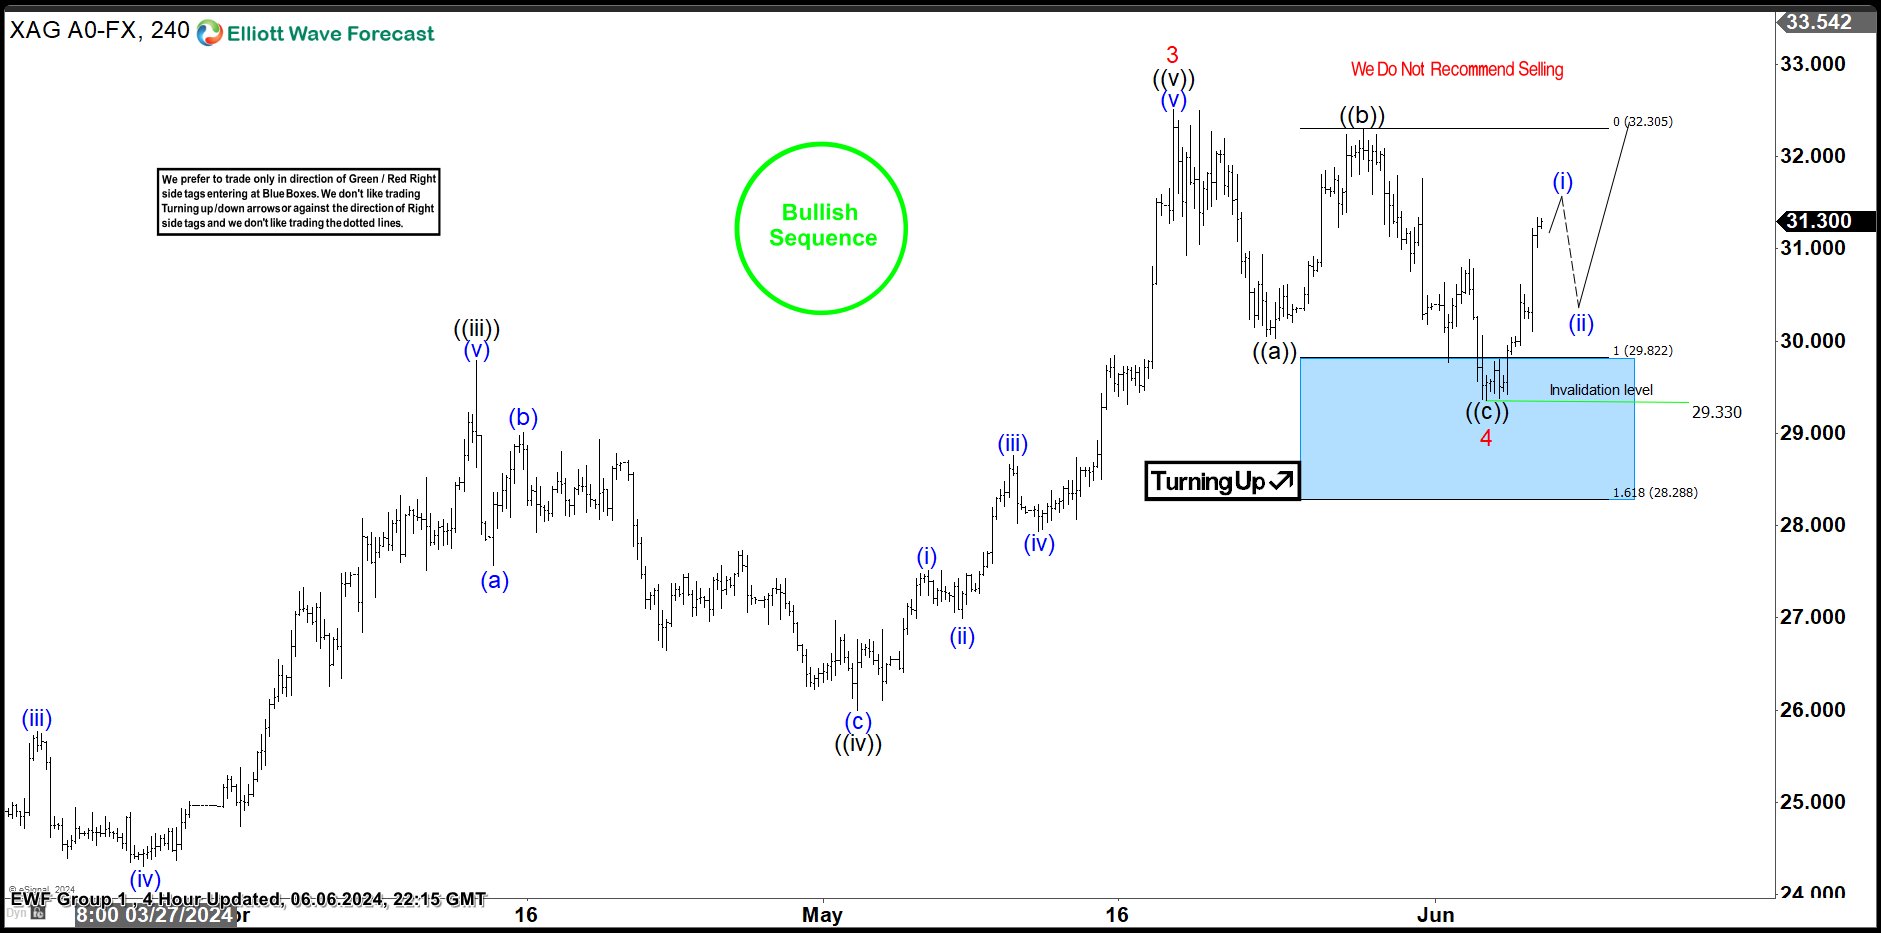
SILVER Elliott Wave 4 Hour Chart 06.06.2024
The commodity made another leg down toward Blue Box area. XAGUSD found buyers within the Blue Box area as expected. We got a nice rally from our buying zone, counting wave 4 correction completed at the 29.33 low. The bounce has exceeded the 50% Fibonacci retracement level against the connector peak. As a result, traders who entered long positions are now enjoying risk-free profits. With the price holding above the 29.33 low, we believe the next leg up can be in progress. We’re looking for a break above the 3 red peak, to confirm next leg up is in progress.


, exclusively presented in the members’ area of our website. As our members know SILVER has recently made pull back that made clear 3 waves down from the May 20th peak . The commodity completed correction right at the Equal Legs zone ( Blue Box Area) . In further text we’re going to explain the Elliott Wave pattern and trading setup.)