Hello traders. Welcome to a new commodity blog post. In this one, we will look at the Copper Elliott wave analysis from our team of analysts. We will especially look at an Elliottwave path discussed in of one of our updates shared with members of ElliottWave-Forecast in May 2024. In conclusion, we will discuss how we will look for the next trade setup on this commodity. Aside from Copper, members get regular Elliott wave updates – five times a day, on 77 other instruments.
In the long term, Copper shows an impulse wave bullish sequence. The intermediate degree impulse wave structure, i.e., (1)-(2)-(3)-(4)-(5), started in October 2023. The price advanced from 3.518 in October 2023 to 5.199 in May 2024. At that high, we recognized that wave (3) of the impulse had been completed. We started analyzing the price action that followed. Our focus was more on the shorter cycles on the H1 and 30-minute charts as we could identify a bearish path in the direction of wave (4) pullback on the higher time frame. On May 23, at 4.7435, we identified wave W of (4). Over a month later, wave X was evolving into a zigzag structure, and we shared the chart below.
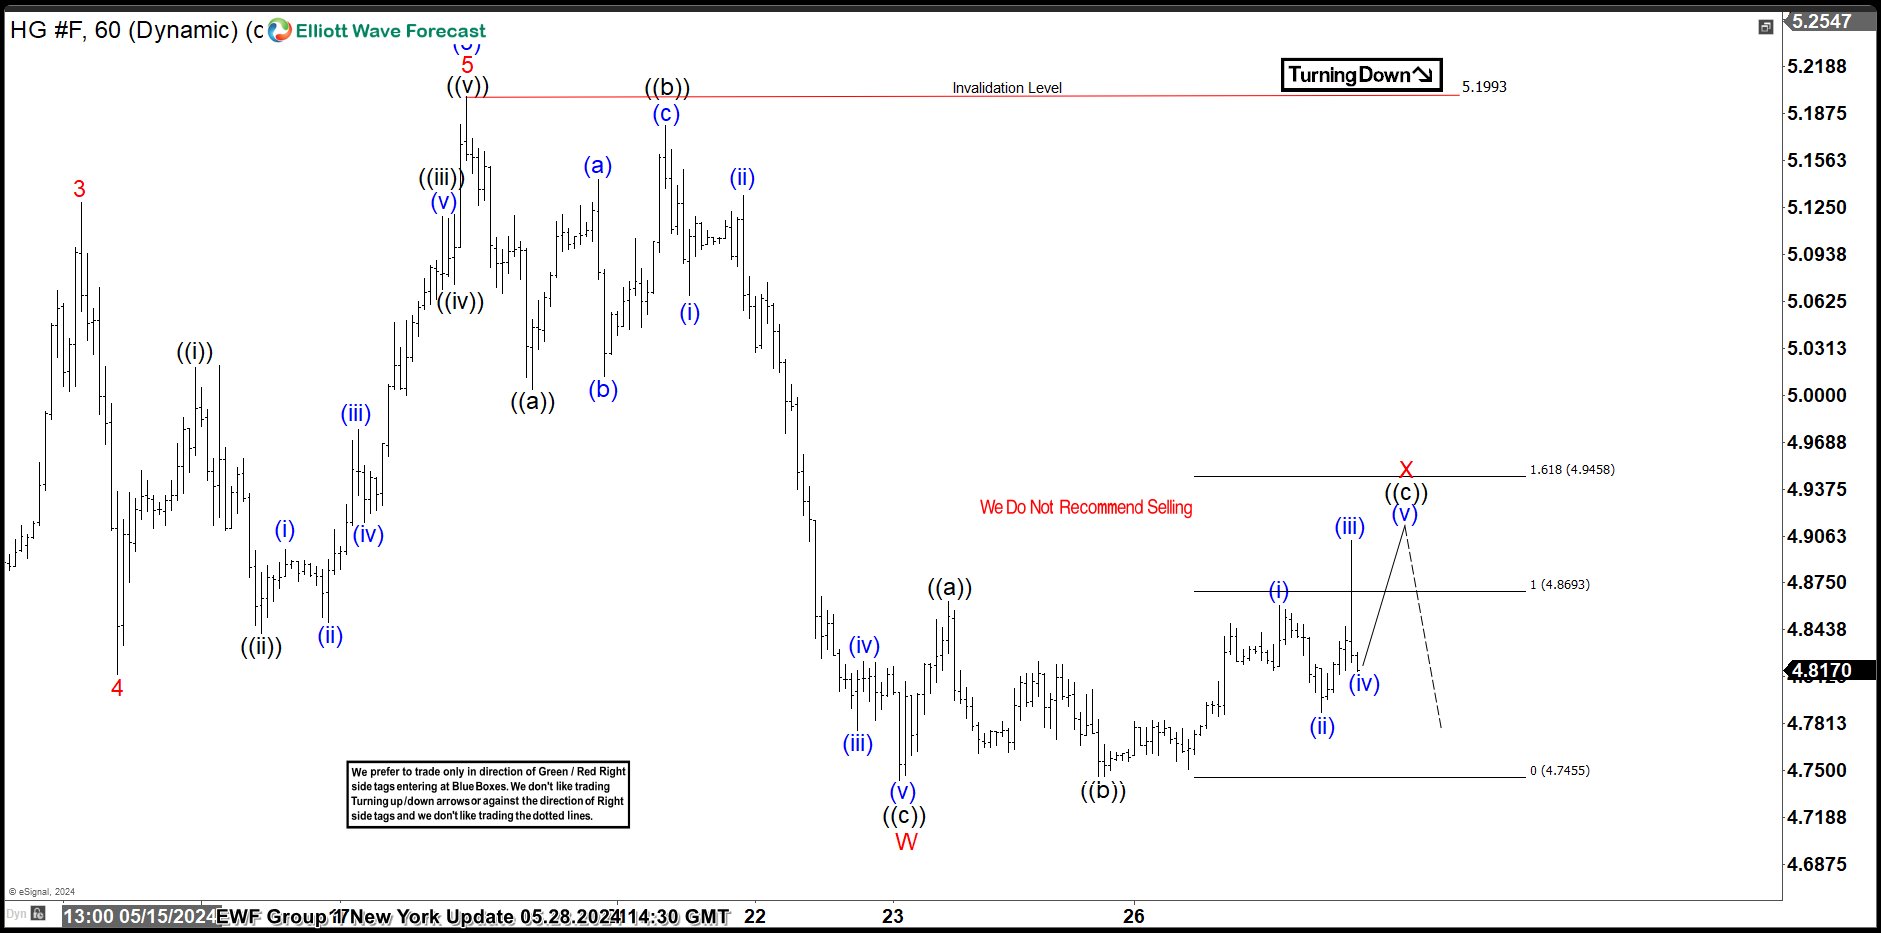
Copper Elliott Wave Analysis – $HG_F, 05.28.2024Copper Elliott Wave Analysis
On May 28, 2024, we shared the chart above with members identifying the extreme zone where wave X should be resisted. The short-term sellers are expected to gain control and drive prices lower for wave Y of (4). From the next day, wave X found resistance as we expected, and the sell-off resumed.
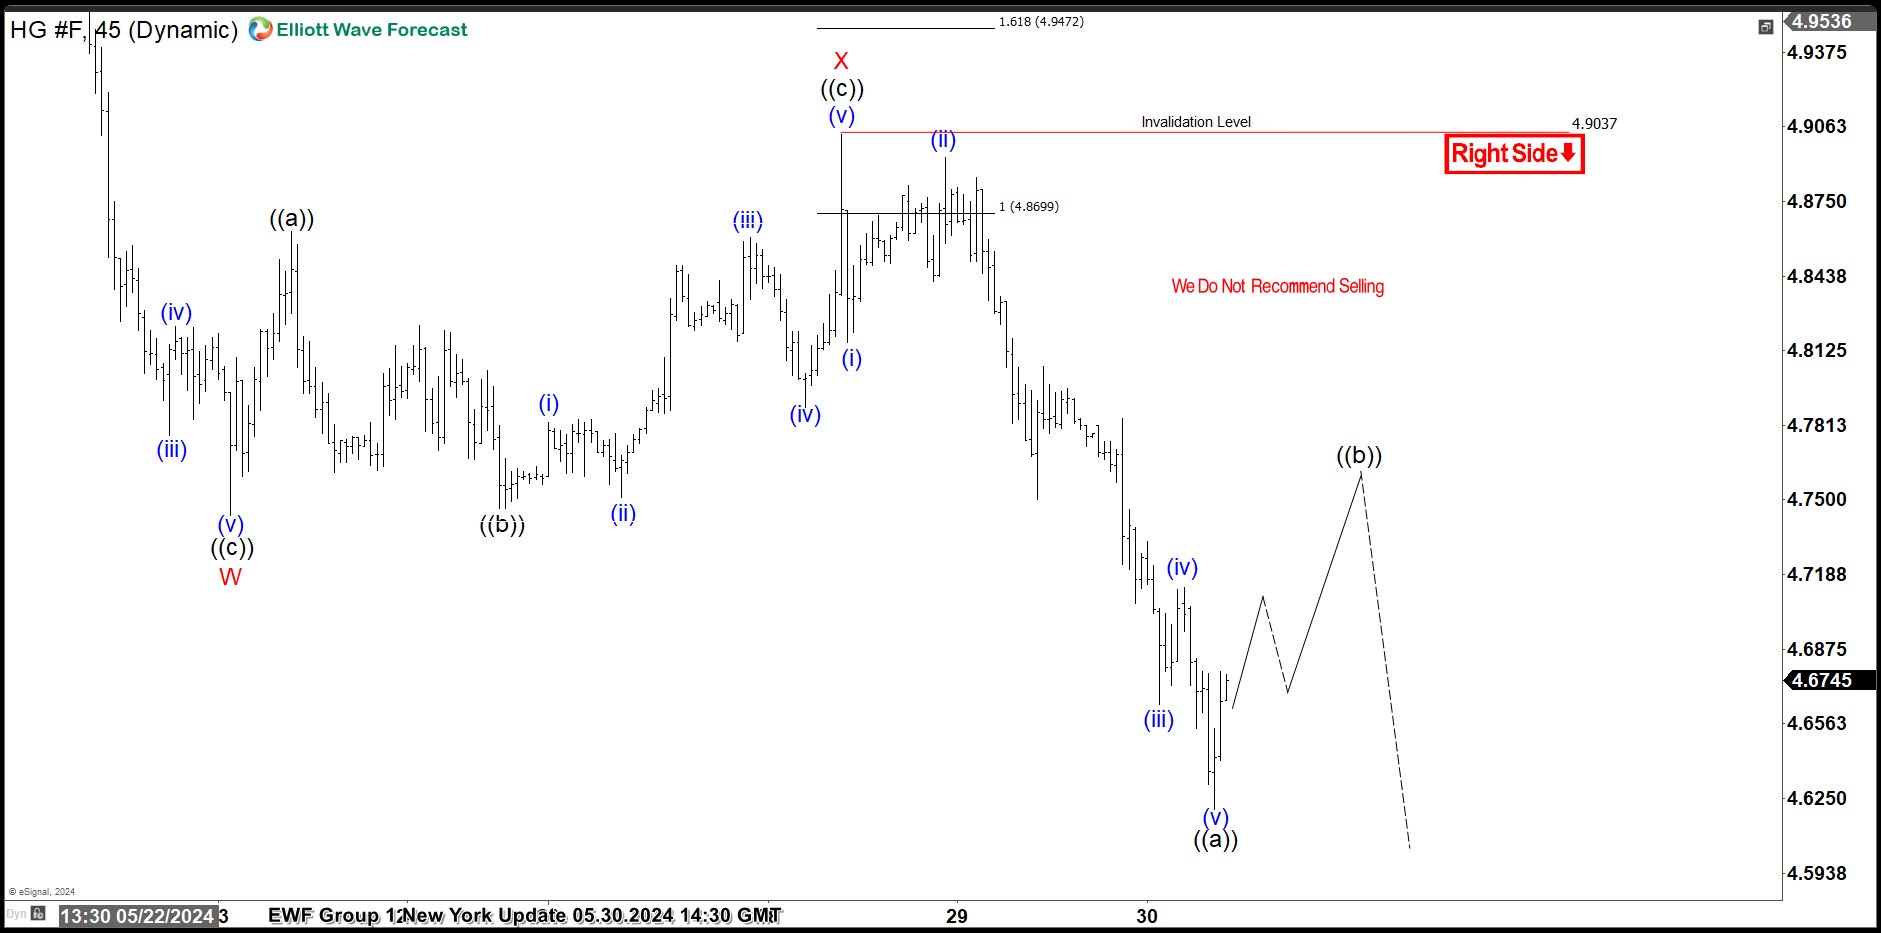
Copper Elliott Wave Analysis – $HG_F, 05.30.2024
We shared the chart above with members two days later. The essence was to emphasize that wave (4) has not yet concluded for buyers to re-enter. We reckoned that the wave ((a)) of Y of (4) could be around the completion stage, paving the way for another bounce for ((b)). In that case, shorter cycles support further decline until wave Y of (4) has concluded. We already have an extreme zone in sight where we expect wave (4) to complete and attract buyers for wave (5). When wave (5) begins, shorter cycles will support buying the pullbacks in 3, 7, or 11 swings.