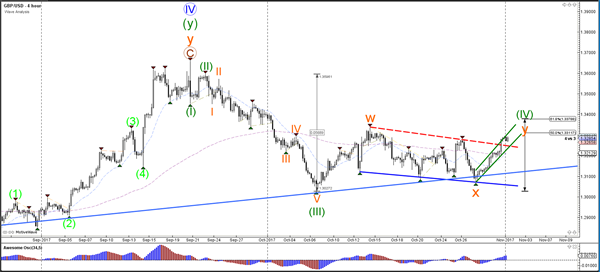
Currency pair GBP/USD
The GBP/USD break above the resistance trend line (dotted red) of the channel and has built a larger correction at the larger support trend lines (blue). A break above the 61.8% Fibonacci level invalidates the bearish wave pattern and indicates that more upside is likely.
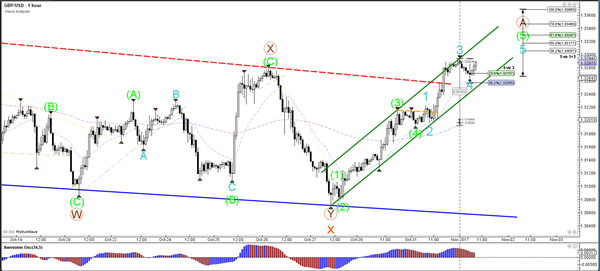
The GBP/USD is showing strong bullish momentum and is building a neat channel to the upside. Price could face sturdy resistance at the Fib levels of the 4 hour chart.
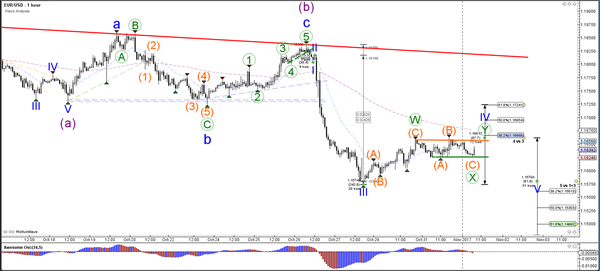
Currency pair EUR/USD
The EUR/USD is still building a bullish retracement within wave 4 (blue). A break below the support of the sideways zone (green) could indicate the continuation of the wave 5 (blue) within a larger wave C (purple).
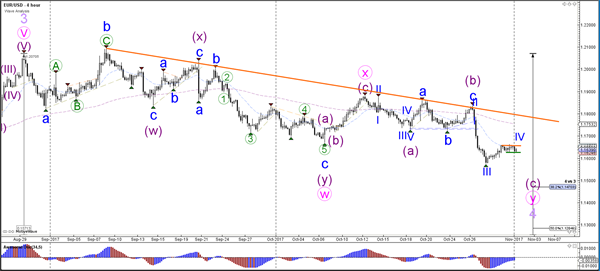
The EUR/USD will most likely complete the wave 4 (blue) if price breaks below the channel (green). In the meantime price could retrace to deeper Fibonacci levels of wave 4 (blue) but typically should not break above the 61.8% Fibonacci level.
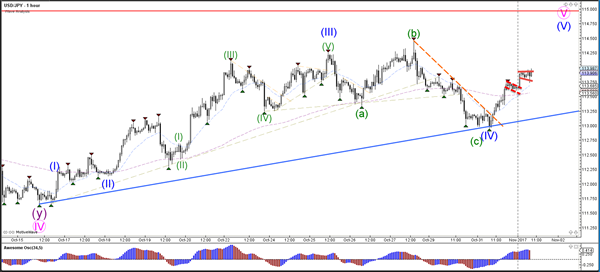
Currency pair USD/JPY
The USD/JPY strong bullish bounce is most likely indicating that one more bullish push is likely towards the 115-resistance level.
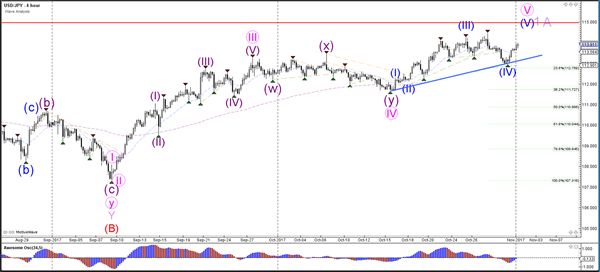
The USD/JPY broke above the resistance trend line (dotted orange) and then broke above the small bull flag chart pattern (dotted red). Price could continue higher if it breaks the next pattern