AUDUSD edged higher in early Thursday’s trading, underpinned by much better than expected Australian trade data and risk mode in stock markets.
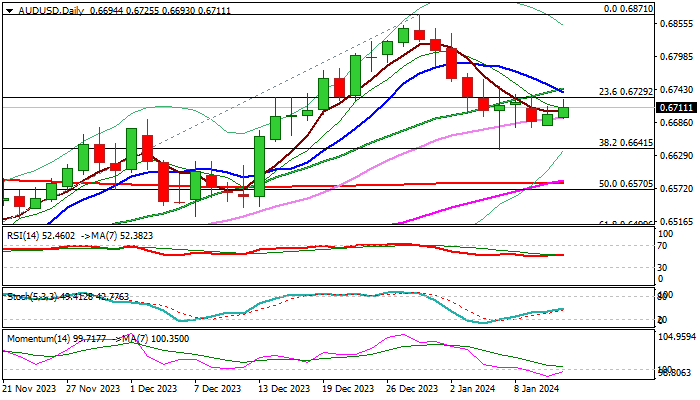
Strong rejection of the pullback from 0.6871 (Dec 28 peak) and pivotal Fibo support at 0.6641 (38.2% of 0.6270/0.6871 rally points to still strong bids, though more work at the upside will be required to generate an initial signal that the corrective phase (0.6871/0.6641) is coming to its end.
Daily studies are mixed, with 10/20DMA bear cross and 14-d momentum, weighing on near-term action, while 55/200DMA golden cross and north heading stochastic and RSI provide support.
Look for initial bullish signal on sustained break of 0.6730/40 zone (double-Fibo barrier / 10/20DMA’s) which would add to bullish bias and open way for stronger recovery.
Conversely, loss of immediate support (0.6677 higher base) would weaken near-term structure for attack at lower pivot at 0.6641, loss of which would risk deeper pullback.
US inflation data (due later today) are key event of the day and expected to provide fresh direction signal.
Res: 0.6729; 0.6755; 0.6782; 0.6800.
Sup: 0.6677; 0.6641; 0.6581; 0.6570.