. It currently stands around 7% higher than the October 27 low with the rally stopping, potentially temporarily, a tad below the previous peak recorded on October 12. Thus, the US 500 index has failed, up to now, to record a higher high and cancel out the bearish pattern of lower lows and lower highs that has been in place since July 27.)
- US 500 cash index trades sideways after recent upleg
- Strong rebound from late-October lows amidst key market events
- Mixed momentum indicators complicate the short-term outlook
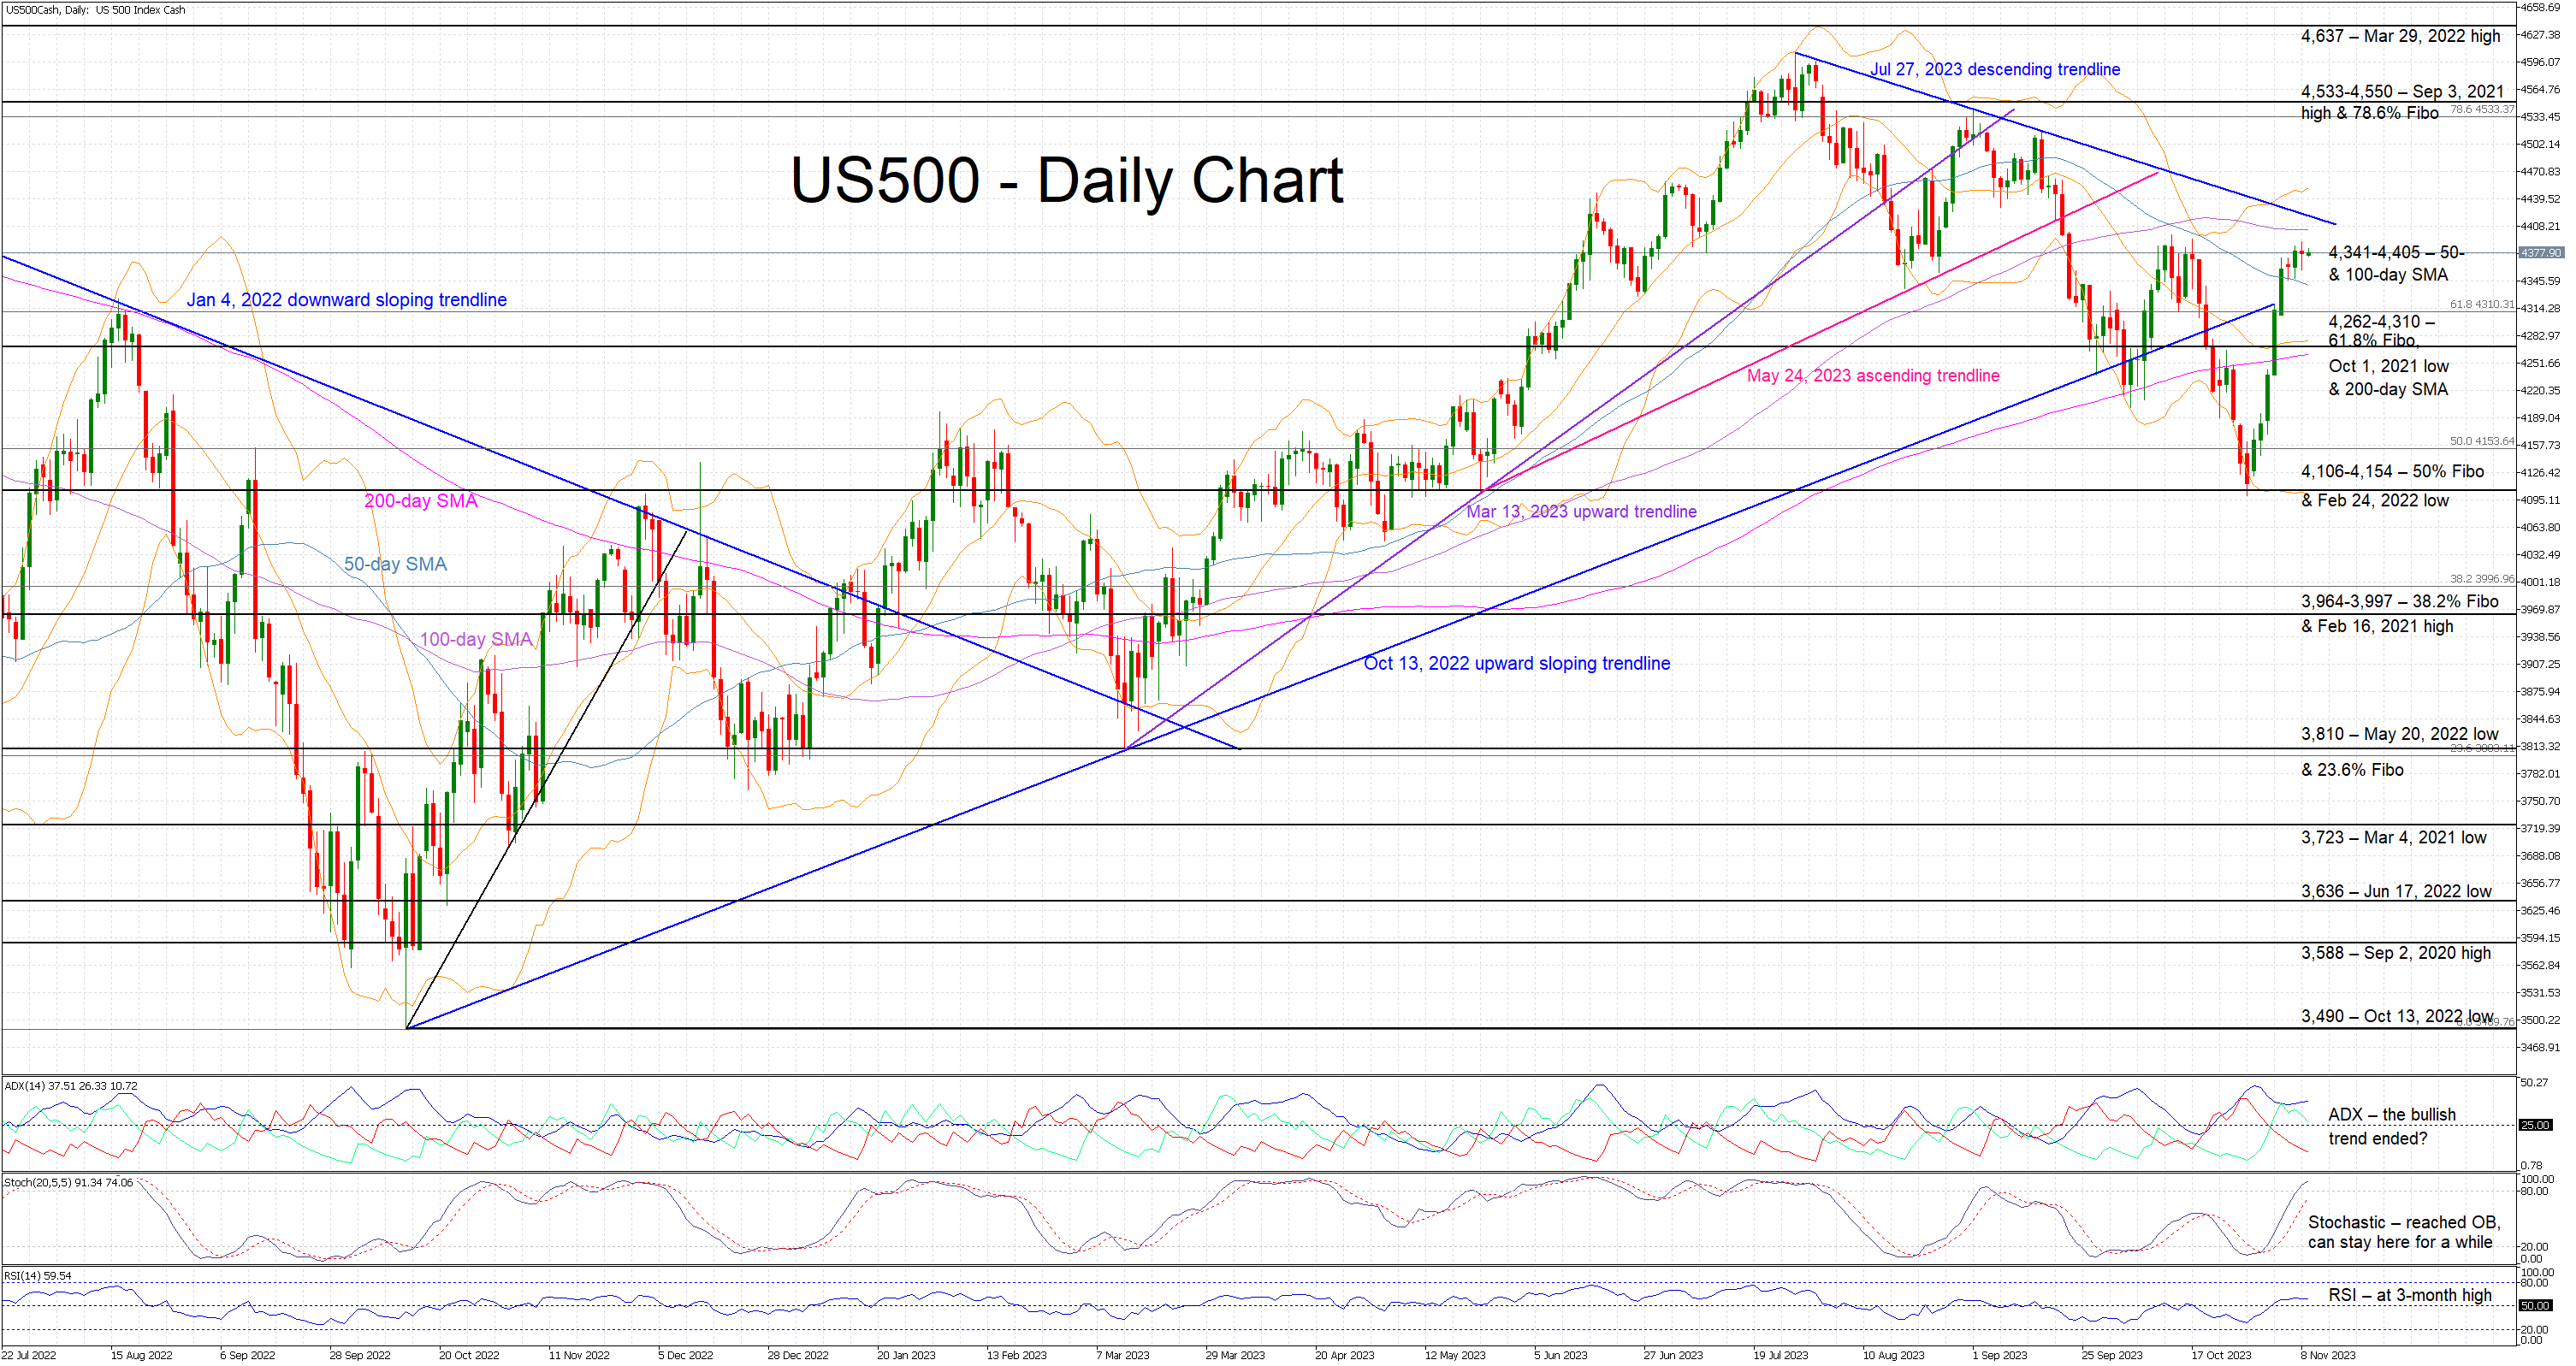
The US 500 cash index is trying to record a green candle today as it trades between the 50- and 100-day simple moving averages (SMAs). It currently stands around 7% higher than the October 27 low with the rally stopping, potentially temporarily, a tad below the previous peak recorded on October 12. Thus, the US 500 index has failed, up to now, to record a higher high and cancel out the bearish pattern of lower lows and lower highs that has been in place since July 27.
The bulls are probably looking at the momentum indicators for clues on the next leg in the US 500 index. The Average Directional Movement Index (ADX) is trading sideways and thus pointing to a weakening bullish trend. Similarly, the RSI is trading at a 3-month high but appears unwilling to move higher. More importantly, the stochastic oscillator has reached its overbought territory, still holding a good gap from the moving average. This is potentially an early sign that the current upleg might not have legs.
Should the bulls remain committed to pushing the US 500 index higher, they could first try to overcome the 4,341-4,405 area. They could then have a go at breaking above the July 27, 2023 descending trendline, which has proved a sizeable resistance point in the recent past. Even higher, the bulls could then set course for the busy 4,533-4,550 range.
On the flip side, the bears are trying to protect their summer gains and look ready to defend the 4,341-4,405 area. If successful, they could then come up against significant support in the 4,262-4,310 range. This is defined by the 61.8% Fibonacci retracement level of the January 4, 2022 – October 12, 2022 downtrend, the October 1, 2021 low and the 200-day SMA. Even lower, the path looks clear until the 4,106-4,154 region.
To conclude, US 500 cash index bulls have staged an impressive comeback from the October lows. However, they are still looking to record a higher high despite the potentially shrinking support from momentum indicators.