
 have started to lose some of their glitter as a safe haven play due to the “status quo” situation in the ongoing Israel-Hamas conflict without any further rise in the geopolitical risk premium at this juncture.)
- Gold’s stagflation hedge purpose has been negated after a rotation back into long-duration risk assets/equities.
- Watch the US$1,972 key short-term resistance on spot Gold (XAU/USD) to maintain on-going corrective decline structure.
- Medium-term uptrend remains intact as long as US$1,903 support holds.
In the past two weeks, the price actions of Spot Gold (XAU/USD) have started to lose some of their glitter as a safe haven play due to the “status quo” situation in the ongoing Israel-Hamas conflict without any further rise in the geopolitical risk premium at this juncture.
Also, a rotation back into long-duration risk assets such as the US mega-cap technology and growth-oriented equities ex-post FOMC Fed Chair Powell’s press conference and the lacklustre US non-farm payrolls and US ISM Services PMI data for October where the Nasdaq 100 recorded a weekly gain of +5.07% last week may have put a damper on gold’s stagflation hedge purpose.
Broke below its 20-day moving average with a minor bearish “Head & Shoulders”
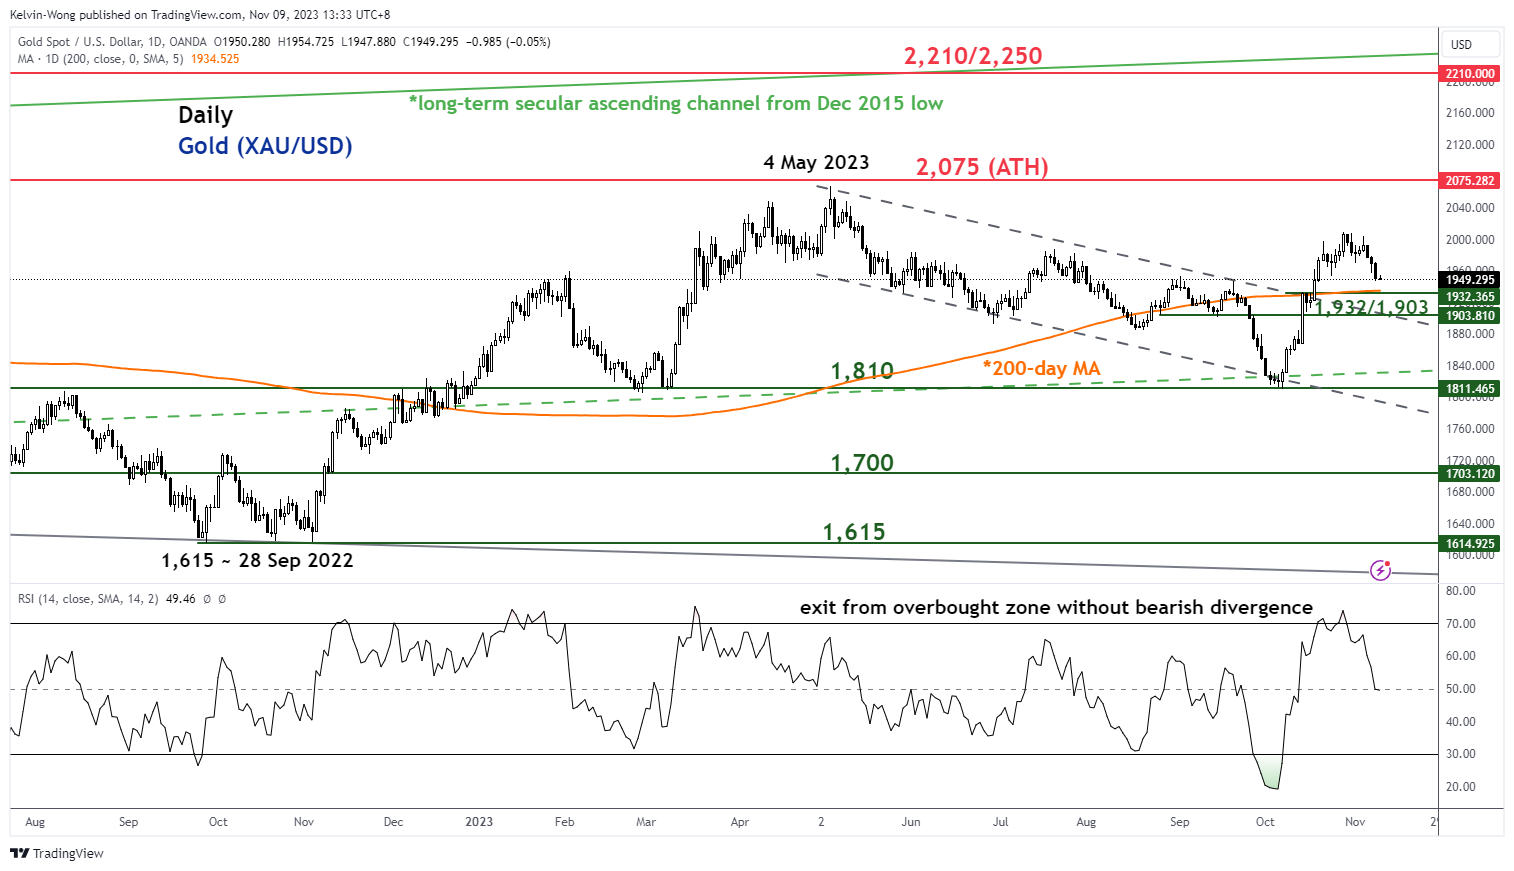
Fig 1: Spot Gold (XAU/USD) medium-term trend as of 9 Nov 2023 (Source: TradingView, click to enlarge chart)
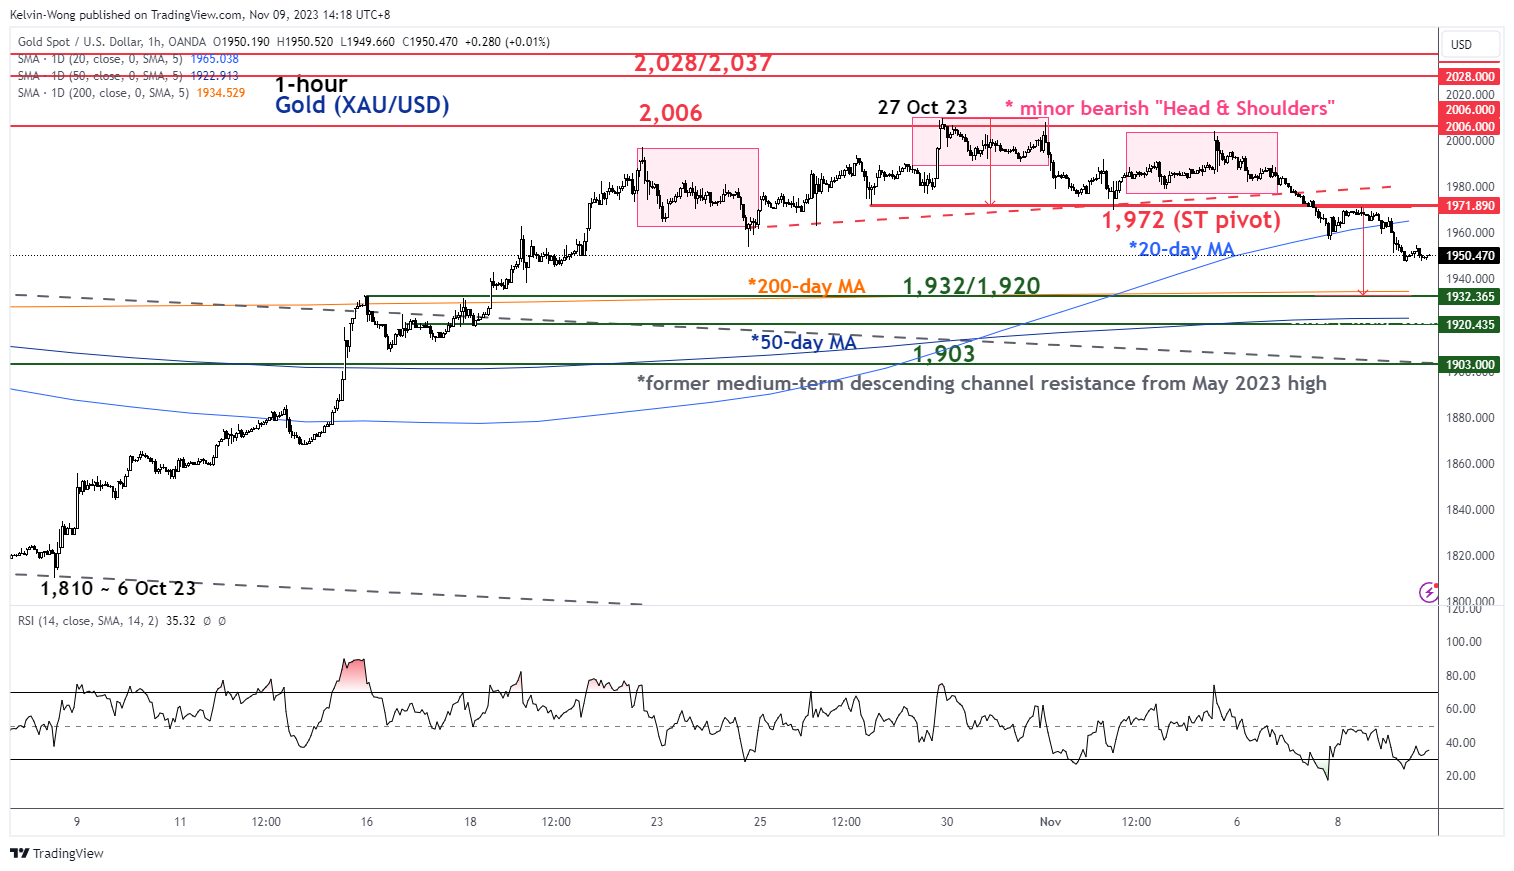
Fig 2: Spot Gold (XAU/USD) minor short-term trend as of 9 Nov 2023 (Source: TradingView, click to enlarge chart)
The medium-term uptrend phase of Gold (XAU/USD) has remained in place since its 6 October low of US$1,810 as its price actions continued to trade above its key 200-day moving average and the pull-back of its former descending channel resistance now acting as a support at US$1,903.
In the short term, Gold (XAU/USD) is likely in the process of undergoing a corrective decline or pull-back sequence to negate the overbought condition of its recent steep rally of +11% from its 6 October low to 27 October 2023 high.
Watch the US$1,972 key short-term pivotal resistance for a further potential slide toward the intermediate support zone of US$1,932/1,920 (50, 200-day moving averages & the exit target potential of the minor bearish “Head & Shoulders” breakout).
Failure to hold at US$1,920 may extend the corrective pull-back towards the key medium-term support of US$1,903 (the pull-back of the former descending channel resistance from the May 2023 high & and close to the 50% Fibonacci retracement of prior rally from 6 October low to 27 October 2230 high).
On the flip side, a clearance above US$1,972 invalidates the corrective pull-back scenario to jumpstart potentially another bullish impulsive upmove sequence towards the minor range resistance of US$2,006 before the next incoming intermediate resistance zone at US$2,028/2,037.