
 surged to 2.7% y/y, beat expectations of 2.3% y/y, and surpassed its August year-to-date peak of 2.6% y/y to hit a 31-year high.)
- Last Friday, 27 Oct price actions of the USD/JPY led to the formation of a weekly bearish reversal “Shooting Star” candlestick right at a key resistance zone of 150.30/150.90.
- Medium-term momentum has turned lacklustre as indicated by the bearish divergence condition seen in the daily RSI.
- Watch the potential downside trigger level of 149.30 (20-day moving average) on the USD/JPY.
Last Friday, 27 October, the price actions of USD/JPY failed to make any headway above a key resistance zone of 150.30/150.90. It printed an intraday high of 150.78 on Thursday, 26 October before it traded lower throughout Friday’s session on the backdrop of a hotter Tokyo’s CPI print where the growth of the core-core inflation rate (excluding fresh food and energy) surged to 2.7% y/y, beat expectations of 2.3% y/y, and surpassed its August year-to-date peak of 2.6% y/y to hit a 31-year high.
Emergence of weekly bearish reversal “Shooting Star” ahead of BoJ
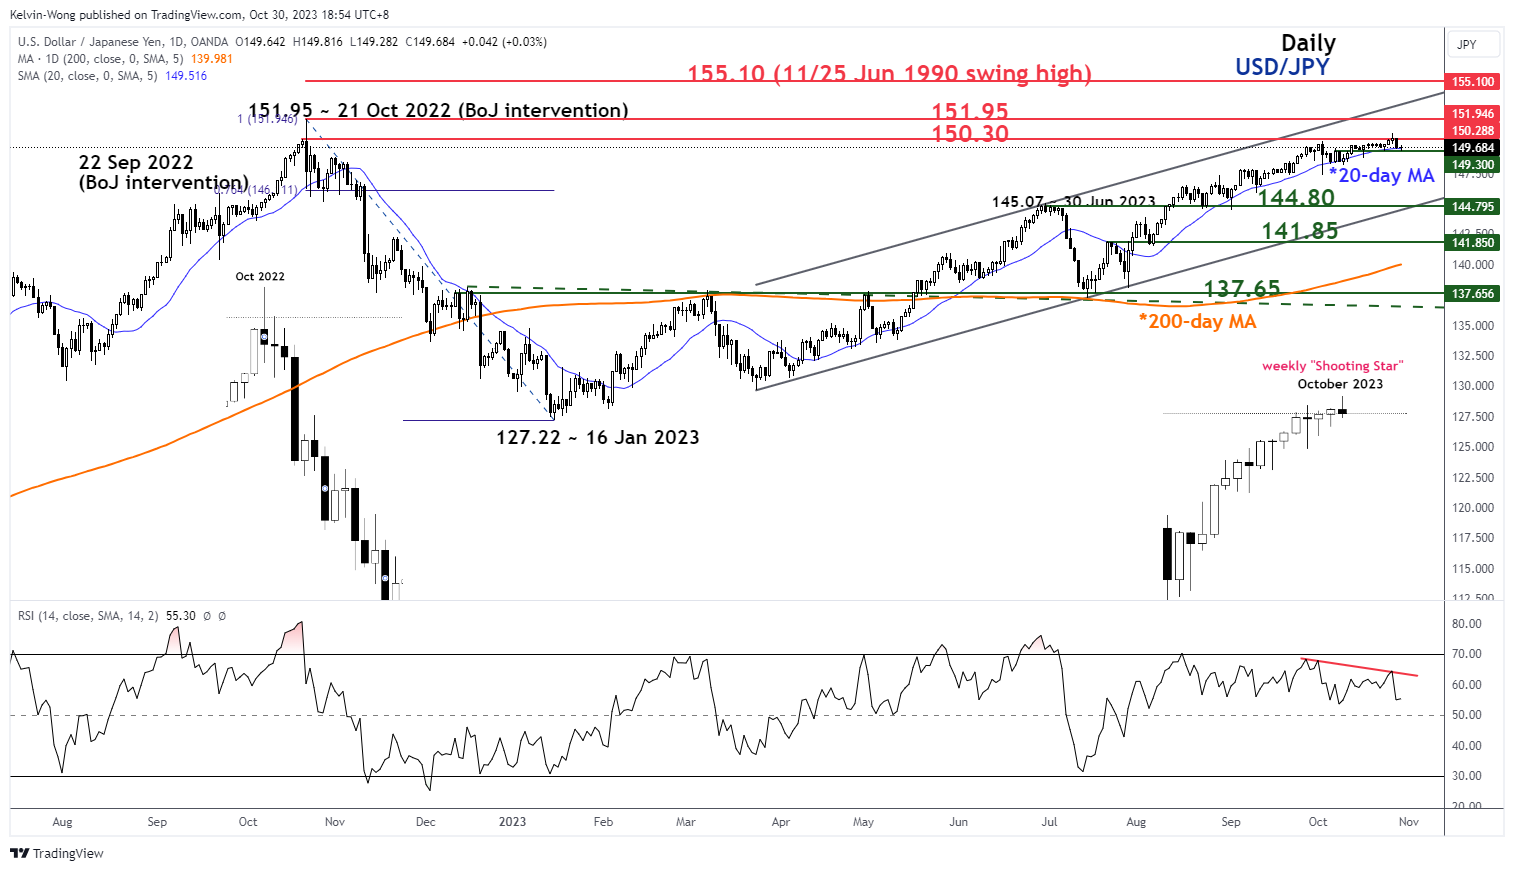
Fig 1: USD/JPY medium-term & major trends as of 30 Oct 2023 (Source: TradingView, click to enlarge chart)
Interestingly, last week’s price actions of the USD/JPY have formed a bearish weekly reversal candlestick pattern called “Shooting Star” ahead of the Bank of Japan (BoJ) monetary policy decision outcome and the release of its latest inflation and growth forecasts in its quarterly outlook report tomorrow, 31 October.
The weekly “Shooting Star” formed at the key resistance zone of 150.30/150.90 increases the odds of a bullish exhaustion scenario which suggests that the year-long rally of USD/JPY in place since the 16 January 2023 low of 127.22 is at risk for a potential multi-week medium-term corrective decline to retrace at least 38.2% of the major uptrend phase from 16 January 2023 low to 26 October 2023 high which gives rise to a potential downside target of a key medium-term support at 141.85 (also close to the key 200-day moving average).
A key point to note will be the prior relentless push up to last year, 21 October 2022 major swing high of 151.95 that saw a three-month decline of -16% thereafter had taken a similar form of weekly bearish reversal candlestick before the former plunge occurred.
In addition, the daily RSI momentum indicator flashed out a bearish divergence condition on last Friday, 27 October which indicates another sign of bullish exhaustion.
Watch the near-term support of 149.30
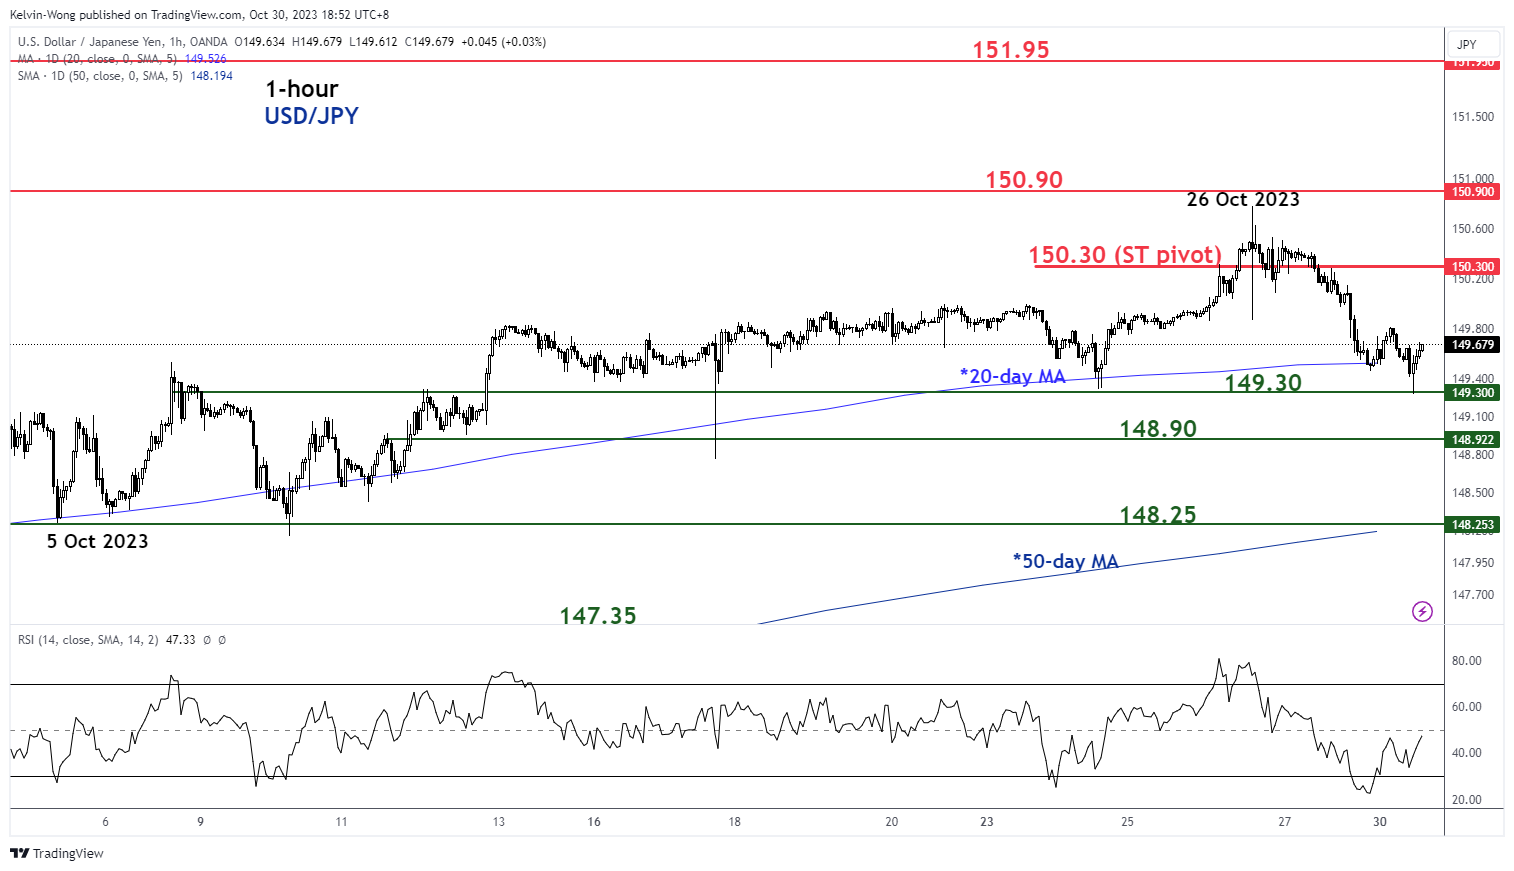
Fig 2: USD/JPY short-term minor trend as of 30 Oct 2023 (Source: TradingView, click to enlarge chart)
In the shorter term as seen on the 1-hour chart, the recent slide in the USD/JPY on last Friday and today’s Asian session (30 October) has managed to stall again at the 20-day moving average that is acting as a support at 149.30.
So far, the 20-day moving average support of USD/JPY has managed to prevent any deeper slide in price actions since 31 July 2023 which in turn makes it a potential downside trigger level.
Watch the 150.30 key short-term pivotal resistance and a clear breakdown with an hourly close below the 20-day moving average support at 149.30 is likely to unleash a further potential down move sequence at least in the short-term towards the next intermediate supports at 148.90 and 148.25 (minor swing lows of 5/10 October 2023 & 50-day moving average) in the first step.
However, a clearance above 150.30 negates the bearish tone for a retest on the upper limit of the key medium-term resistance at 150.90, and above it sees the major resistance coming in at 151.95.