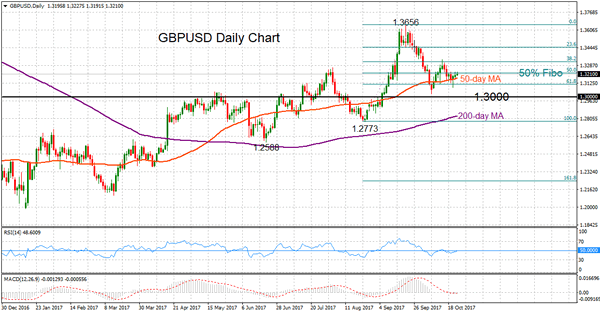
GBPUSD has been maintaining a soft bias since peaking at 1.3656. The pair has managed to trade above the key 1.3000 level since declining from the September 20 high and this looks like a strong support level, which if broken would increase downside pressure.
The market has mainly been pivoting around the 50% Fibonacci retracement level (1.3215) of the upleg from 1.2773 to 1.3656 over the last three weeks.
The neutral bias of the RSI and MACD indicators suggest more sideways trading at least in the near-term. There are few signs for a real push higher due to the lack of momentum in the market. A break below the 50-day moving average at 1.3167 could trigger a drop back towards the 1.3000 area. A deeper decline would strengthen downside momentum and shift the focus back to the 1.2773 low.
Looking at the bigger picture, GBPUSD has been slowly shifting higher since April. The market is trading above the positively aligned 50- and 200-day moving averages which keeps the odds for a bullish trend to remain in play. The consolidative phase is expected to remain in the short-term and only a move above 1.3318 (38.2% Fibonacci) would help trigger a rally back towards 1.3656.

